Loops in shell scripting

If you are die hard Bourne Shell (/bin/sh) scripter, it can be a challenge not to be enticed by the syntax niceties of the Born Again Borne Shell (/bin/bash).

One example is the {..} syntax

#!/bin/bash
for I in {0..5}
do
   echo $I
done
0
1
2
3
4
5

This syntax is not valid in /bin/sh on Linux.

#!/bin/sh
for I in {0..5}
do
   echo $I
done
{0..5}

NOTE: However apparently it does work in Mac OS X, which is derived from BSD, not Linux.

/bin/sh gives you a for loop but it requires the full list of iterated values instead of a range.

#!/bin/sh

for I in 0 1 2 3 4 5
do
  echo $I
done

Note: Passing a string does not work by default.

#!/bin/sh

for I in "0 1 2 3 4 5"
do
  echo $I
done

The approach to product the same result requires some format management.

#!/bin/sh

OIFS=$IFS
IFS=" "
for I in `echo "0 1 2 3 4 5"`
do
  echo $I
done
IFS=$OIFS

You can use while

#!/bin/sh

I=0
while [ $I -le 5 ]
do 
  echo $I
  I=`expr $I + 1`
done

You can use one of several other shell commands, in this example awk

#!/bin/sh

for I in `awk 'BEGIN{for (i=0;i<=5;i++) print i}'`
do 
  echo $I
done

Or, the function specifically design for sequences of numbers seq

#!/bin/sh

for I in `seq 0 5`
do 
  echo $I
done

And for these few examples, there will be more possibilities to achieve close to feature parity of the /bin/bash syntax.
An example found on BSD is jot - 0 5. This is not available Ubuntu by default but installed with the athena-jot package. However the syntax is then different for correct usage.
Improving performance – A full stack problem

Improving the performance of a web system involves knowledge of how the entire technology stack operates and interacts. There are many simple and common tips that can provide immediate improvements for a website. Some examples include:

  • Using a CDN for assets
  • Compressing content
  • Making fewer requests (web, cache, database)
  • Asynchronous management
  • Optimizing your SQL statements
  • Have more memory
  • Using SSD’s for database servers
  • Updating your software versions
  • Adding more servers
  • Configuring your software correctly
  • … And the general checklist goes on

Understanding where to invest your energy first, knowing what the return on investment can be, and most importantly the measurement and verification of every change made is the difference between blind trial and error and a solid plan and process. Here is a great example for the varied range of outcome to the point about “Updating your software versions”.

On one project the MySQL database was reaching saturation, both the maximum number of database connections and maximum number of concurrent InnoDB transactions. The first is a configurable limit, the second was a hard limit of the very old version of the software. Changing the first configurable limit can have dire consequences, there is a tipping point, however that is a different discussion. A simple software upgrade of MySQL which had many possible improvement benefits, combined with corrected configuration specific for this new version made an immediate improvement. The result moved a production system from crashing consistently under load, to at least barely surviving under load. This is an important first step in improving the customer experience.

In the PHP application stack for the same project the upgrading of several commonly used frameworks including Slim and Twig by the engineering department seemed like a good idea. However applicable load testing and profiling (after it was deployed, yet another discussion point) found the impact was a 30-40% increase in response time for the application layer. This made the system worse, and cancelled out prior work to improve the system.

How to tune a system to support 100x load increase with no impact in performance takes knowledge, experience, planning, testing and verification.

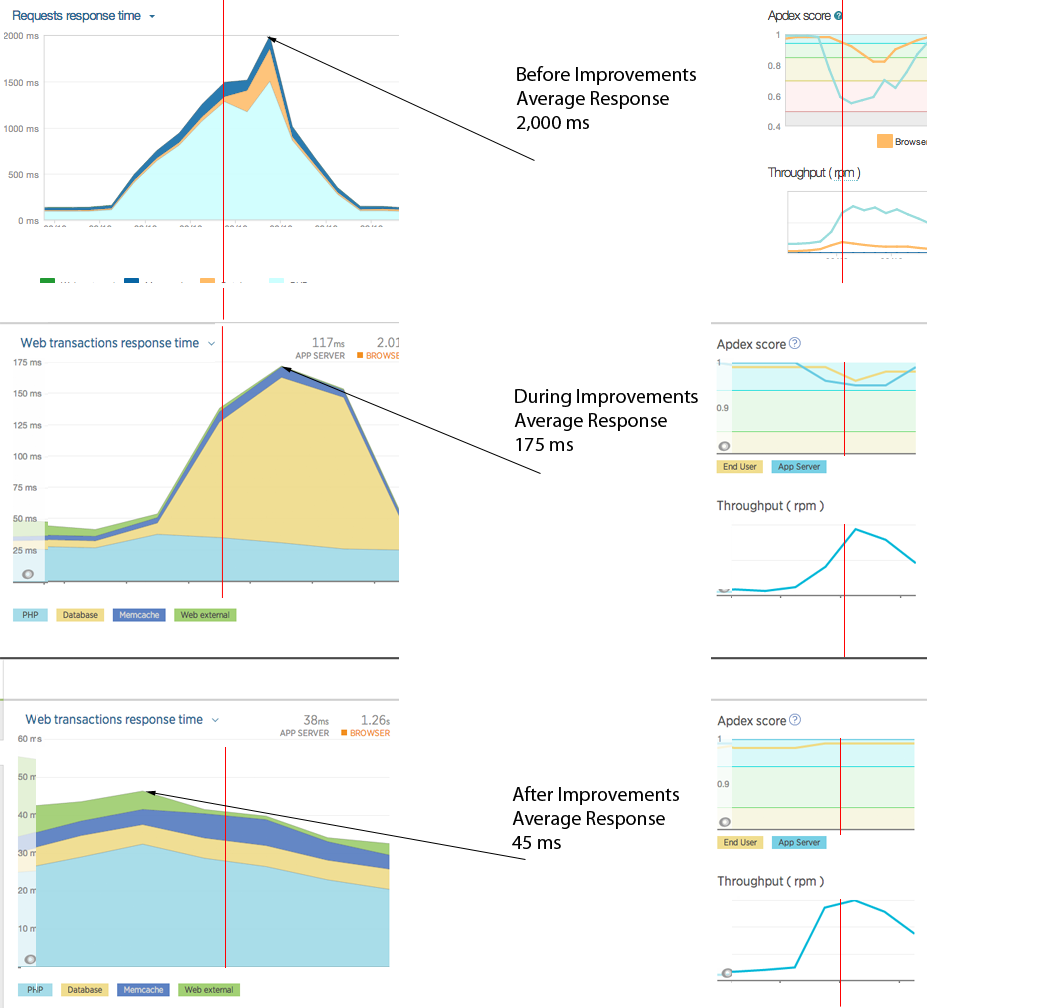
The following summarized graphs; using New Relic monitoring as a means of representative comparison; shows three snapshots of the average response time during various stages of full stack tuning and optimization. This is a very simplified graphical view that is supported by more detailed instrumentation using different products, specifically with much finer granularity of hundreds of metrics.

These graphs represent the work undertaken for a system under peak load showing an average 2,000ms response time, to the same workload under 50ms average response time. That is a 40x improvement!

If your organization can benefit from these types of improvements feel free to Contact Me.

There are numerous steps to achieving this. A few highlights to show the scope of work you need to consider includes:

  • Knowing server CPU saturation verses single core CPU saturation.
  • Network latency detection and mitigation.
  • What are the virtualization mode options of virtual cloud instances?
  • Knowing the network stack benefits of different host operating systems.
  • Simulating production load is much harder than it sounds.
  • Profiling, Profiling, Profiling.
  • Instrumentation can be misleading. Knowing how different monitoring works with sampling and averaging.
  • Tuning the stack is an iterative process.
  • The simple greatest knowledge is to know your code, your libraries, your dependencies and how to optimize each specific area of your technology stack.
  • Not everything works, some expected wins provided no overall or observed benefits.
  • There is always more that can be done. Knowing when to pause and prioritize process optimizations over system optimizations.

These graphs show the improvement work in the application tier (1500ms to 35ms to 25ms) and the database tier (500ms to 125ms to 10ms) at various stages. These graphs do not show for example improvements made in DNS resolution, different CDNs, managing static content, different types and ways of compression, remove unwanted software components and configuration, standardized and consistent stack deployments using chef, and even a reduction in overall servers. All of these successes contributed to a better and more consistent user experience.

40x performance improvements in LAMP stack

Identify package management file contents

Recently when implementing Milliseconds in MySQL Proxy Lua Script I needed to identify what was installed from a given package.

For CentOS

$ sudo yum install -y yum-utils
$ repoquery -q -l --plugins lua-socket

/usr/lib64/lua/5.1/mime
/usr/lib64/lua/5.1/mime/core.so
/usr/lib64/lua/5.1/socket
/usr/lib64/lua/5.1/socket/core.so
/usr/share/doc/lua-socket-2.0.2
/usr/share/doc/lua-socket-2.0.2/LICENSE
/usr/share/doc/lua-socket-2.0.2/README
/usr/share/doc/lua-socket-2.0.2/dns.html
/usr/share/doc/lua-socket-2.0.2/ftp.html
/usr/share/doc/lua-socket-2.0.2/http.html
/usr/share/doc/lua-socket-2.0.2/index.html
/usr/share/doc/lua-socket-2.0.2/installation.html
/usr/share/doc/lua-socket-2.0.2/introduction.html
/usr/share/doc/lua-socket-2.0.2/ltn12.html
/usr/share/doc/lua-socket-2.0.2/luasocket.png
/usr/share/doc/lua-socket-2.0.2/mime.html
/usr/share/doc/lua-socket-2.0.2/reference.css
/usr/share/doc/lua-socket-2.0.2/reference.html
/usr/share/doc/lua-socket-2.0.2/smtp.html
/usr/share/doc/lua-socket-2.0.2/socket.html
/usr/share/doc/lua-socket-2.0.2/tcp.html
/usr/share/doc/lua-socket-2.0.2/udp.html
/usr/share/doc/lua-socket-2.0.2/url.html
/usr/share/lua/5.1/ltn12.lua
/usr/share/lua/5.1/mime.lua
/usr/share/lua/5.1/socket
/usr/share/lua/5.1/socket.lua
/usr/share/lua/5.1/socket/ftp.lua
/usr/share/lua/5.1/socket/http.lua
/usr/share/lua/5.1/socket/smtp.lua
/usr/share/lua/5.1/socket/tp.lua
/usr/share/lua/5.1/socket/url.lua

For Ubuntu

$ dpkg-query -L liblua5.1-socket2

/.
/usr
/usr/share
/usr/share/doc
/usr/share/doc/liblua5.1-socket2
/usr/share/doc/liblua5.1-socket2/README
/usr/share/doc/liblua5.1-socket2/copyright
/usr/share/doc/liblua5.1-socket2/changelog.Debian.gz
/usr/share/lua
/usr/share/lua/5.1
/usr/share/lua/5.1/ltn12.lua
/usr/share/lua/5.1/mime.lua
/usr/share/lua/5.1/socket
/usr/share/lua/5.1/socket/http.lua
/usr/share/lua/5.1/socket/url.lua
/usr/share/lua/5.1/socket/tp.lua
/usr/share/lua/5.1/socket/ftp.lua
/usr/share/lua/5.1/socket/smtp.lua
/usr/share/lua/5.1/socket.lua
/usr/lib
/usr/lib/liblua5.1-mime.so.2.0.0
/usr/lib/liblua5.1-socket.so.2.0.0
/usr/lib/liblua5.1-unix.so.2.0.0
/usr/lib/lua
/usr/lib/lua/5.1
/usr/lib/lua/5.1/mime
/usr/lib/lua/5.1/socket
/usr/lib/liblua5.1-mime.so.2
/usr/lib/liblua5.1-socket.so.2
/usr/lib/liblua5.1-unix.so.2
/usr/lib/lua/5.1/mime/core.so
/usr/lib/lua/5.1/socket/core.so
/usr/lib/lua/5.1/socket/unix.so

Understanding installing MySQL rpm versions

I have a problem with an easy way to install MySQL via rpm without resorting to specifying the exact point release of MySQL. Presently my local yum repository has versions of 5.0, 5.1,5.4 and 5.5.

If I want to install MySQL Sever, I can just run:

$ sudo yum install -y MySQL-server
Setting up Install Process
Package MySQL-server-community-5.5.0-1.rhel5.x86_64 already installed and latest version
Nothing to do

The issue here is the most current version is installed. If I want to install the most current version of 5.1 for example, I have found no way to specify MySQL-server-5.1, or MySQL-server-community-5.1, I have to specify the point release MySQL-server-community-5.1.40

I suspect there is some internal aliasing that may be possible within rpm’s to support this. I’m seeking help from any rpm experts and would appreciate any feedback.

My current products include:

$ sudo yum list MySQL-server-community
Installed Packages
MySQL-server-community.x86_64      5.5.0-1.rhel5        installed
Available Packages
MySQL-server-community.x86_64      5.0.82-0.rhel5       mydb-rhel5-server-x86_64
MySQL-server-community.x86_64      5.0.82-0.rhel5       mydb-rhel5-x86_64
MySQL-server-community.x86_64      5.1.40-0.rhel5       mydb-rhel5-server-x86_64
MySQL-server-community.x86_64      5.1.40-0.rhel5       mydb-rhel5-x86_64
MySQL-server-community.x86_64      5.4.3-0.rhel5        mydb-rhel5-server-x86_64
MySQL-server-community.x86_64      5.4.3-0.rhel5        mydb-rhel5-x86_64
MySQL-server-community.x86_64      5.5.0-1.rhel5        mydb-rhel5-server-x86_64
MySQL-server-community.x86_64      5.5.0-1.rhel5        mydb-rhel5-x86_64

MySQL Permissions – Restarting MySQL

I am working with a client that is using managed hosting on dedicated servers. This has presented new challenges in obtaining the right permissions to undertake MySQL tasks but not have either ‘root’ or ‘mysql’ access and not have to involve a third party everytime.

Adding the following to the /etc/sudoers file enabled the ability to restart MySQL.

User_Alias	DBA = rbradfor, user2, etc
Host_Alias 	DB_SERVERS = server1.example.com, server2.example.com, etc
Cmnd_Alias	MYSQL = /etc/init.d/mysqld, /usr/sbin/tcpdump

DBA DB_SERVERS = MYSQL

As you can see I also got tcpdump, which I find valuable to monitor via mk-query-digest.

Next, permissions for log files.

Monitoring MySQL options

My recent poll What alert monitoring do you use? showed 25% of the 58 respondents to bravely state they had no MySQL monitoring. I see 1 in 3, ~33% in my consulting so this is consistent.


There is no excuse to not have some MySQL Monitoring on your production system. At the worse case, you should be logging important MySQL information for later analysis. I use my own Logging and Analyzing scripts on every client for an immediate assessment regardless of what’s available. I combine that with my modified statpack to give me immediate text based analysis, broken down by hour chunks for quick reference. These help me in troubleshooting, but they are not a complete solution.

The most popular options I see and are also reflected in the results are:

There is a good list, including some products I did not know. My goal is to get this information included in the Monitoring-MySQL information site.

I have some additional information on Cacti and MONyog, and I’ll be sharing this information in upcoming posts.

Using the Query Cache effectively

Maximize your strengths, minimize your weaknesses.

You can apply this approach to many things in life, I apply it to describing and using MySQL the product, and it’s components. The Query Cache like many features in MySQL, and indeed features in many different RDBMS products (don’t get me started on Oracle *features*) have relative benefits. In one context it can be seen as ineffective, or even detrimental to your performance, however it’s course grain nature makes it both trivial to disable dynamically (SET GLOBAL query_cache_size=0;), and also easy to get basic statistics on current performance (SHOW GLOBAL STATUS LIKE ‘QCache%';) to determine effectiveness and action appropriately.

The Query Cache is course grained, that is it is rather simple/dumb in nature. When you understand the path of execution of a query within the MySQL kernel you learn a few key things.

  • When enabled, by default the Query Cache will cache all SELECT statements within certain defined system parameter conditions. There are of course exceptions such as non-deterministic functions, prepared statements in earlier versions etc.
  • Any DML/DDL statement for a table that has a query cached, flushes all query cache results that pertain to this table.
  • You can use SQL_CACHE and SQL_NO_CACHE as hints however you can’t configure on a table by table, or query basis.
  • The query cache works on an exact match of the query (including spaces and case) and other settings such the client character set, and protocol version. If a match is found, data is returned in preformed network packets.<.li>

The Query Cache was not good when set to large values (e.g. > 128M) due to in-efficient cache invalidation. I’m not certain of the original source of this condition however Bug #21074, fixed in 5.0.50 and 5.1.21 is likely the reason.

My advice is to disable the Query Cache by default, especially for testing. As a final stress test you can enable to determine if there is a benefit.

I wish MySQL would spend time in improving key features, for example the Query Cache lacks sufficient instrumentation like what queries are in the cache, what tables are in the cache, and also lack all the sufficient system parameters exposed to fine tune. I believe there is a patch to show the queries for example, but I was unable to find via a google search.

It is a powerful and easy technology if you use it well. It involves architecting your solution appropriately, and knowing when the Query Cache is ineffective.

I have a number of circumstances where the query cache is extremely effective, or could be with simple modifications. A recommendation to a recent client with a 1+TB database was to split historical and current data into two different instances. The data was already in separated tables, the application already performed dual queries, so the change was a simple as a new connection pool. The benefits were huge, not only would the backup process be more efficient, some 500GB of data now only had to be backed up once (as is was 100% static), the scaling and recovery process improved, but the second MySQL instance could enable the query cache and the application would get a huge performance improvement with ZERO code changes for caching. That’s a quick and easy win.

On a side note, I wanted to title this “The MySQL Query Cache is not useless”. When I was a MySQL employee I got reprimanded (twice) for blogging anything about MySQL that wasn’t positive. This blog post is in direct response to Konstantin, a Sun/MySQL employee who actually works on the actually MySQL server code who wrote Query cache = useless?. In my view it is not useless.

Identifying Resource Bottlenecks – Disk

With a discussion on identifying CPU and Memory bottlenecks achieved, let us now look at how Disk can affect MySQL performance.

One of the first steps when addressing a MySQL performance tuning problem is to perform a system audit of the physical hardware resources (CPU,Memory,Disk,Network), then identify any obvious bottlenecks in these resources.

There are several commands you can use including vmstat, iostat and sar (both part of the sysstat package) to provide information on disk I/O.

vmstat is a good place to start for an overall view for multiple resources, however for disk it only provides a total system overview.

procs -----------memory---------- ---swap-- -----io---- -system-- ----cpu----
 r  b   swpd   free   buff  cache   si   so    bi    bo   in   cs us sy id wa
  4  0 249256 107768 116360 1519596    0    0     0   112 8151 11256 40  4 56  0
 3  0 249256 107588 116360 1519680    0    0     4  1068 8021 11514 51  2 47  0
 1  0 249256 107396 116360 1519788    0    0     0    88 8880 12832 35  6 60  0
 0  0 249256 107432 116360 1519928    0    0     4    40 9393 14561  8  4 89  0
 2  0 249256 107160 116360 1519988    0    0     4  5636 9790 14245 23  6 71  0
 1  0 249256 107140 116360 1520356    0    0     4   180 9077 13285 33  3 65  0
 3  0 249256 107100 116360 1520352    0    0     0  1516 7970 13099 22  2 75  0
 4  1 249256 107184 116360 1520476    0    0     4   108 9756 15478 67  4 29  0
 2  0 249256 106196 116360 1520652    0    0     0     0 9512 14212 61  4 35  0

We want to look at is bi, bo and wa. The descriptions of these columns from the man page is:

  • bi: Blocks received from a block device (blocks/s).
  • bo: Blocks sent to a block device (blocks/s).
  • wa: Time spent waiting for IO.

As you can see from this above example, there is no disk reading, just disk writing, and there is no wait for I/O. This is good.

procs -----------memory---------- ---swap-- -----io---- -system-- ----cpu----
 r  b   swpd   free   buff  cache   si   so    bi    bo   in   cs us sy id wa
 3  2 888552  86716 321940 712480   32  636  5352  1800 18177 22731 31  9 29 31
 0  5 888552  86748 321944 712592    0    0  2072   264 15592 19435 27  6 45 23
 4  5 888552  86296 321944 712796   16    0  5556  8388 15559 19674 28  5 11 55
 4  2 888552  86112 321948 713408   24    0  4404  4936 15215 19354 26  6 20 48
 6  0 888552  85732 321948 713608   56    0  6348  4368 15123 19109 25  5 37 34
 2  3 888552  85188 321956 713936   60    0  3080  4104 16322 21044 29  6 48 18
 2  3 888552  84972 321964 714376   20    0  4464 10852 20483 26013 33  9 25 34
 1 10 888552  84772 321980 714724   12    0  9332 12868 16981 21948 28  6 19 48
 2  3 888552  84080 321988 714952  112    0 11144  8944 15973 20190 27  6  1 65

In this above example we see a production system that has high disk reads and writes, and wait I/O is high. If you see the CPU waiting for Disk I/O at 60%-70%-80% you have effectively reached disk saturation.

procs -----------memory---------- ---swap-- -----io---- -system-- ----cpu----
 r  b   swpd   free   buff  cache   si   so    bi    bo   in   cs us sy id wa
 0 28      0  14436   4616 2405504    0    0     0     2  101   92  0  0  0 100
 0  4      0  14320   4616 2405504    0    0   120  2300  191  213  0  0  1 98
 0  5      0  15064   4616 2405056    0    0  1688    62 1961 2080  2  0 32 63
 0  4      0  14136   4616 2405916    0    0   952   272  584  569  0  0  0 98
 0  5      0  16864   4624 2403068    0    0   336    76  886 1389  2  1  0 97
 0  3      0  16052   4624 2403928    0    0   800   288  373  352  0  0  0 99
 0  3      0  15380   4624 2404556    0    0   720   240  373  357  0  0  0 98
 0  3      0  14452   4624 2405588    0    0   912   400  330  324  1  0  0 97
 0 57      0  15688   4624 2404380    0    0  1956   893  439  828  1  0  0 97
 0 56      0  15572   4632 2404544    0    0   208    12  947 1402  2  0  0 97
 0 53      0  14784   4632 2405320    0    0   784     1  310  261  0  0  0 98
 0 50      0  14436   4632 2405664    0    0   288   120  175  140  0  0  0 99
 0 50      0  14228   4632 2405688    0    0   160     0   97   85  0  0  0 100
 1 49      0  14112   4632 2406032    0    0   276     0  183  184  0  0  0 100

In the above example the system is past total disk saturation. The system is waiting completely for disk. This is the output of an actual production system. This is a good example because it is important to look at all three figures. Look at how low the amount of bi/bo in ration to wa. This is an indicator of a potential underlying disk subsystem problem, and in-fact this system failed within 24 hours of this output. I have never see 100% Disk Wait I/O before this example.

To get an indication of load on a multi disk system you need to use iostat for example. In the following example, we have an idle system with two drives. I simulate load on sdb with the following command.

$ dd if=/dev/zero of=/disk1/dd.out bs=1024k count=10000
$ iostat 5
Device:            tps   Blk_read/s   Blk_wrtn/s   Blk_read   Blk_wrtn
sda               2.80         1.60        97.60          8        488
sdb               2.80         0.00        25.60          0        128

avg-cpu:  %user   %nice %system %iowait  %steal   %idle
           0.10    0.00    0.05    0.10    0.00   99.75

Device:            tps   Blk_read/s   Blk_wrtn/s   Blk_read   Blk_wrtn
sda               5.80        19.20       225.60         96       1128
sdb               0.00         0.00         0.00          0          0

avg-cpu:  %user   %nice %system %iowait  %steal   %idle
           0.80    0.00   11.86    6.30    0.00   81.04

Device:            tps   Blk_read/s   Blk_wrtn/s   Blk_read   Blk_wrtn
sda              19.20        17.60       294.40         88       1472
sdb              18.20         0.00     18246.40          0      91232

avg-cpu:  %user   %nice %system %iowait  %steal   %idle
           0.40    0.00    3.15   34.88    0.00   61.57

Device:            tps   Blk_read/s   Blk_wrtn/s   Blk_read   Blk_wrtn
sda              35.20        30.40     14409.60        152      72048
sdb              86.20         1.60     83763.20          8     418816

avg-cpu:  %user   %nice %system %iowait  %steal   %idle
           1.30    0.00    1.45   38.87    0.00   58.38

Device:            tps   Blk_read/s   Blk_wrtn/s   Blk_read   Blk_wrtn
sda              30.80         4.80       451.20         24       2256
sdb              84.40         0.00     84172.80          0     420864

avg-cpu:  %user   %nice %system %iowait  %steal   %idle
           2.40    0.00    1.15   35.43    0.00   61.02

Device:            tps   Blk_read/s   Blk_wrtn/s   Blk_read   Blk_wrtn
sda              15.40         3.20       270.40         16       1352
sdb              84.80         0.00     83353.60          0     416768

You can see from this example, the increase in blocks written to sdb, and overal %iowait.

If you want to do a blanket test of your disk subsystem you should consider a program that adequately test the different interactions, especially any caching or battery backed cached that your system may have. I have written several articles on using Bonnie++ including Using Bonnie++, Extending Bonnie++ and Bonnie++ Results.

There are a number of variables that make it more difficult to audit disks. RAID configuration is often difficult as this involves custom OS/RAID provider commands. The disk controller cache, and battery backed cache (BBRU) are just two factors. It is important you know these commands, you study them and most importantly you know when your system is running in a degraded mode. The popular Dell 1950/2950 etc series generally have PERC 5/6i cards, you can use the folllowing as a guide to Understanding PERC RAID Controllers.

My 60 second take on RAID and Disk Configuration. I concur with Matt Yonkivit. You should separate your OS from your database on disk, RAID 1 (2 drives) works fine for the OS. For databases, in theory (pure math when understanding RAID), RAID10 is better then RAID5.

MySQL DML stats per table

MySQL provides a level of statistics for your INSERT, UPDATE, DELETE, REPLACE Data Manipulation Language (DML) commands using the STATUS output of various Com_ variables, however it is per server stats. I would like per table stats.

You can achieve this with tools such as MySQL Proxy and mk-query-digest, however there is actually a very simple solution that requires no additional tools.
The following 1 line Linux command (reformatted for ease of reading) gave me exactly what I wanted, and it had ZERO impact on the database.

$ mysqlbinlog /path/to/mysql-bin.000999 |  
   grep -i -e "^update" -e "^insert" -e "^delete" -e "^replace" -e "^alter"  | 
   cut -c1-100 | tr '[A-Z]' '[a-z]' |  
   sed -e "s/t/ /g;s/`//g;s/(.*$//;s/ set .*$//;s/ as .*$//" | sed -e "s/ where .*$//" |  
   sort | uniq -c | sort -nr


  33389 update e_acc
  17680 insert into r_b
  17680 insert into e_rec
  14332 insert into rcv_c
  13543 update e_rec
  10805 update loc
   3339 insert into r_att
   2781 insert into o_att
...

Granted the syntax could do with some regex improvements, but in 2 minutes I was able to deduce some approximate load. The mysqlbinlog command also gives option to retrieve data for a given time period, so it is very easy to get these statistics on a per hour basis.

Sometimes the most simple options are right in front of you, just just need to strive to find the simplest solution.

Has your blog been hacked?

While not a MySQL topic, as most of my readers view my MySQL Blog, my WordPress blog has been hacked? Has yours?

Like many, I’m sure you may have read about it like at WordPress blogs under attack from hack attack but I was surprised when my custom permlinks did not work.

Being surprised I looked at Administrator accounts, and I found that there was one more number then being displayed in the list. I had to dig into the database to find the problem.

mysql> select * from wp_users where ID in (select user_id from wp_usermeta where meta_key = 'wp_capabilities' and meta_value like '%admin%');
+-----+-------------+------------------------------------+---------------+------------------------------+---------------------------+---------------------+---------------------+-------------+--------------+
| ID  | user_login  | user_pass                          | user_nicename | user_email                   | user_url                  | user_registered     | user_activation_key | user_status | display_name |
+-----+-------------+------------------------------------+---------------+------------------------------+---------------------------+---------------------+---------------------+-------------+--------------+
|   1 | admin       | $P$BHZFK/prDplb/W/024yrH49JvAmmCE. | ronald        | [email protected] | http://ronaldbradford.com | 2005-11-21 23:43:47 |                     |           0 | Ronald       |
| 127 | ronald      | $P$B..e75VtFsv9bUGj5H5NTiXXPQIitr1 | ronald        | [email protected]    | http://ronaldbradford.com | 2009-02-22 20:13:33 |                     |           0 | ronald       |
| 133 | ChaseKent87 | $P$Bl8cVSzBums33Md6u2PQtUVY2PPBHK. | chasekent87   |                              |                           | 2009-09-05 06:36:59 |                     |           0 | ChaseKent87  |
+-----+-------------+------------------------------------+---------------+------------------------------+---------------------------+---------------------+---------------------+-------------+--------------+
3 rows in set (0.00 sec)

mysql> delete from wp_users where ID=133;
mysql> delete from wp_usermeta where user_id=133;

However the damage has been done, and an update to the recommend 2.8.4 is unlikely to fix the data corruption.

Being a good DBA I have a nightly backup of my database. Being a diligent system administrator, I have not 1 copy, by 3 copies of my system, one on my web site and two offsite.

The problem is I don’t keep older backups of my data, only a day old version.

What do you monitor in MySQL?

If you are unfamiliar with what to monitor in MySQL, starting with looking at what popular Monitoring products monitor. For example, the following is the list of MySQL Cacti Plugin measurements.

Innodb Buffer Pool Activity

  • Pages Created
  • Pages Written
  • Pages Read

Innodb Buffer Pool Pages

  • Pool Size
  • Database Pages
  • Free Pages
  • Modified Pages

Inoodb File I/O

  • File Reads
  • Files Writes
  • Log Writes
  • File Fsyncs

Innodb Pending I/O

  • Aio Log Ios
  • Aio Sync ios
  • Buffer Pool Flushes
  • Chkp Writes
  • Ibuf Aio Reads
  • Log Flushes
  • Log Writes
  • Normal Aio Reads
  • Normal Aio Writes

Innodb Insert Buffer

  • Inserts
  • Merged
  • Merges

Innodb Log

  • Log Buffer Size
  • Log Bytes Written
  • Log Bytes Flushed
  • Unflushed Log

Innodb Row Operations

  • Rows Read
  • Rows Deleted
  • Rows Updated
  • Rows Inserted

Innodb Semaphores

  • Spin Rounds
  • Spin Waits
  • OS Waits

Innodb Transactions

  • Innodb Transactions
  • Current Transactions
  • History List
  • Read Views

MySQL Binary/Relay Logs

  • Binlog Cache use
  • Binlog Cache Disk Use
  • Binary Log Space
  • Relay Log Space

MySQL Command Counters

  • Questions
  • SELECT
  • DELETE
  • INSERT
  • UPDATE
  • REPLACE
  • LOAD
  • DELETE MULTI
  • INSERT SELECT
  • UPDATE MULTI
  • REPLACE SELECT

MySQL Connections

  • Max Connections
  • Max Used Connections
  • Aborted Clients
  • Aborted Connects
  • Threads Connected
  • Connections

MySQL Files and Tables

  • Table Cache
  • Open Tables
  • Open Files
  • Opened Tables

MySQL Network Traffic

  • Bytes Received
  • Bytes Sent

MySQL Processlist

  • State Closing Tables
  • State Copying to Tmp Table
  • State End
  • State Freeing Items
  • State Init
  • State Locked
  • State Login
  • State Preparing
  • State Reading From Net
  • State Sending Data
  • State Sorting Result
  • State Statistics
  • State Updating
  • State Writing to Net
  • State None
  • State Other

MySQL Query Cache

  • Queries In Cache
  • Hits
  • Inserts
  • Not Cached
  • Lowmem Prunes

MySQL Query Cache Memory

  • Query Cache Size
  • Free Memory
  • Total Blocks
  • Free Blocks

MySQL Replication

  • Slave Running
  • Slave Stopped
  • Slave Lag
  • Slave Open Temp Tables
  • Slave Retried Transactions

MySQL Select Types

  • Select Full Join
  • Select Full Range Join
  • Select Range
  • Select Range Check
  • Select Scan

MySQL Sorts

  • Sort Rows
  • Sort Range
  • Sort Merge Passes
  • Sort Scan

MySQL Table Locks

  • Table Locks Immediate
  • Table Locks Waited
  • Slow Queries

MySQL Temporary Objects

  • Created Tmp Tables
  • Created Tmp Disk Tables
  • Created Tmp Files

MySQL Threads

  • Thread Cache Size
  • Threads Created

SQL query analysis with MySQL Proxy

Long before there was the official Query Analyzer (QUAN), a component of MySQL Enterprise, SQL analysis was possible using MySQL Proxy.

The following is an introduction to logging and query analysis with MySQL Proxy.

Get MySQL Proxy

You need to first download MySQL Proxy. In this example I am using the Linux RHEL5 64bit OS and Version 0.7.2

$ wget http://dev.mysql.com/get/Downloads/MySQL-Proxy/mysql-proxy-0.7.2-linux-rhel5-x86-64bit.tar.gz/from/http://mirror.trouble-free.net/mysql_mirror/
$ tar xvfz mysql-proxy-0.7.2-linux-rhel5-x86-64bit.tar.gz
$ ln -s mysql-proxy-0.7.2-linux-rhel5-x86-64bit mysql-proxy
$ export PATH=`pwd`/mysql-proxy/sbin:$PATH
$ mysql-proxy --help-all

Pre-requisites

MySQL Proxy uses TCP/IP, so it is important you connect via the actual hostname. You should first confirm this, as appropriate MySQL permissions may be necessary. For example:

$ mysql -h`hostname` -u -p

On confirmation this works, you can then connect directly to the proxy

$ mysql -h`hostname` -P4040 -u -p

Logging

$ cd mysql-proxy/share/doc/mysql-proxy/
$ wget -O log.lua http://ronaldbradford.com/mysql-dba/mysql-proxy/log.lua
$ mysql-proxy --proxy-lua-script=share/doc/mysql-proxy/log.lua &
$ tail -f mysql.log

This script is based on simple query logging which requires a modification to work in more current versions of MySQL proxy.

$ mysql -hhostname -P4040 -u -p
mysql>  SELECT host,user,password FROM mysql.user;
mysql>  SELECT table_schema,COUNT(*) FROM information_schema.tables GROUP BY table_schema;
mysql>  SELECT NOW(), SLEEP(3);
mysql>  EXIT
$ cat mysql.log
2009-09-02 17:15:01     58 -- select @@version_comment limit 1
2009-09-02 17:16:15     58 -- SELECT host,user,password FROM mysql.user
2009-09-02 17:16:30     58 -- SELECT table_schema,COUNT(*) FROM information_schema.tables GROUP BY table_schema
2009-09-02 17:16:39     58 -- SELECT NOW(), SLEEP(3)

Query Analysis

Restart proxy with the histogram.lua sample provided.

$ mysql-proxy --proxy-lua-script=share/doc/mysql-proxy/histogram.lua &

Connect and run some queries.

$ mysql -hhostname -P4040 -u -p
mysql>  SELECT host,user,password FROM mysql.user;
mysql>  SELECT table_schema,COUNT(*) FROM information_schema.tables GROUP BY table_schema;
mysql>  SELECT NOW(), SLEEP(3);

While connected to the proxy, you can now review data from two pseudo tables.

mysql>  SELECT * FROM histogram.tables;
mysql>  SELECT * FROM histogram.queriesG
mysql>  DELETE FROM histogram.tables;
mysql>  DELETE FROM histogram.queries;

mysql> SELECT * FROM histogram.tables;
+---------------------------+-------+--------+
| table                     | reads | writes |
+---------------------------+-------+--------+
| information_schema.tables |     1 |      0 |
| mysql.user                |     1 |      0 |
+---------------------------+-------+--------+

mysql> SELECT * FROM histogram.queries;
+--------------------------------------------------------------------------------------------------+-------+----------------+----------------+
| query                                                                                            | count | max_query_time | avg_query_time |
+--------------------------------------------------------------------------------------------------+-------+----------------+----------------+
| SELECT @@version_comment LIMIT ?                                                                 |     1 |            300 |            300 |
| SELECT `table_schema` , COUNT( * ) FROM `information_schema` . `tables` GROUP BY `table_schema`  |     1 |           1822 |           1822 |
| SELECT `host` , `user` , `password` FROM `mysql` . `user`                                        |     1 |            494 |            494 |
| SELECT NOW( ) , SLEEP( ? )                                                                       |     1 |        3000735 |        3000735 |
+--------------------------------------------------------------------------------------------------+-------+----------------+----------------+

Moving forward

The power is that with Lua you have the flexibility to write your own logging. Some improvements to these scripts could be.

  • Add the query time, number of rows, and result set size to the logging
  • Be able to sort histogram results or see top percentile. Being able to copy data into real tables would enable any level of analysis
  • Combine the logging and histogram scripts
  • Enable global enable/disabling of logging with SET GLOBAL commands
  • Support variable length IN queries, those that pass multiple values, so you end up with a subset of all queries
  • Provide a actual query example, making it easy to do a QEP. For normalized queries you need to do additional work to find values.
  • The histogram does not support the C API multi query functionality, where multiple queries can be passed to the server at one time. The problem is there is no way to time the individual queries.

Read on in SQL Analysis with MySQL Proxy – Part 2.

References

A good introduction document
MySQL Proxy – From architecture to implementation – OSCON 2008

Seeking public data for benchmarks

I have several side projects when time permits and one is that of benchmarking various MySQL technologies (e.g. MySQL 5.0,5.1,5.4), variants (e.g. MariaDB, Drizzle) and storage engines (e.g. Tokutek, Innodb plugin) and even other products like Tokyo Cabinet which is gaining large implementations.

You have two options with benchmarks, the brute force approach such as Sysbench, TPC, sysbench, Juice Benchmark, iibench, mysqlslap, skyload. I prefer the realistic approach however these are always on client’s private data. What is first needed is better access to public data for benchmarks. I have compiled this list to date and I am seeking additional sources for reference.

Of course, the data is only the starting point, having representative transactions and queries to execute and a framework to execute and a reporting module are also necessary. The introduction of Lua into Sysbench may now be a better option then my tool of choice mybench which I use simply because I can configure, write and deploy generally for a client in under 1 hour.

If anybody has other good references to free public data that’s easily loadable into MySQL please let me know.

Setting up a Virtual IP address (VIP)

These instructions are for CentOS/Redhat Linux distributions.

1. Identify your current NIC’s and IP addresses in use.

$ /sbin/ifconfig
eth0      Link encap:Ethernet  HWaddr 00:30:48:98:9C:A6
          inet addr:192.168.53.201  Bcast:192.168.53.255  Mask:255.255.255.0
          inet6 addr: 0080::230:48ff:fe98:9ca6/64 Scope:Link
          UP BROADCAST RUNNING MULTICAST  MTU:1500  Metric:1
          RX packets:6159779 errors:0 dropped:0 overruns:0 frame:0
          TX packets:6137085 errors:0 dropped:0 overruns:0 carrier:0
          collisions:0 txqueuelen:100
          RX bytes:1158210510 (1.0 GiB)  TX bytes:541617489 (516.5 MiB)
          Memory:e8000000-e8020000

lo        Link encap:Local Loopback
          inet addr:127.0.0.1  Mask:255.0.0.0
          inet6 addr: ::1/128 Scope:Host
          UP LOOPBACK RUNNING  MTU:16436  Metric:1
          RX packets:3791468208 errors:0 dropped:0 overruns:0 frame:0
          TX packets:3791468208 errors:0 dropped:0 overruns:0 carrier:0
          collisions:0 txqueuelen:0
          RX bytes:740660664181 (689.7 GiB)  TX bytes:740660664181 (689.7 GiB)

Determine which NIC you want the VIP on, in this case eth0 (the private address). We want to add the address 192.168.53.220

$  echo "DEVICE=eth0
BOOTPROTO=static
BROADCAST=192.168.53.255
IPADDR=192.168.53.220
NETMASK=255.255.255.0
NETWORK=192.168.53.0
ONBOOT=yes" > /etc/sysconfig/network-scripts/ifcfg-eth0:0
$ /etc/sysconfig/network-scripts/ifup-aliases eth0

Check your /sbin/ifconfig and now you should have a virtual IP address.

$ /sbin/ifconfig
eth0      Link encap:Ethernet  HWaddr 99:30:48:98:9C:A6
          inet addr:192.168.53.201  Bcast:192.168.53.255  Mask:255.255.255.0
          inet6 addr: 0080::230:48ff:fe98:9ca6/64 Scope:Link
          UP BROADCAST RUNNING MULTICAST  MTU:1500  Metric:1
          RX packets:6159779 errors:0 dropped:0 overruns:0 frame:0
          TX packets:6137085 errors:0 dropped:0 overruns:0 carrier:0
          collisions:0 txqueuelen:100
          RX bytes:1158210510 (1.0 GiB)  TX bytes:541617489 (516.5 MiB)
          Memory:e8000000-e8020000

eth0:0    Link encap:Ethernet  HWaddr 99:30:48:98:9C:A7
          inet addr:192.168.53.220  Bcast:192.168.53.255  Mask:255.255.255.0
          UP BROADCAST RUNNING MULTICAST  MTU:1500  Metric:1
          Memory:e8100000-e8120000

lo        Link encap:Local Loopback
          inet addr:127.0.0.1  Mask:255.0.0.0
          inet6 addr: ::1/128 Scope:Host
          UP LOOPBACK RUNNING  MTU:16436  Metric:1
          RX packets:3791468208 errors:0 dropped:0 overruns:0 frame:0
          TX packets:3791468208 errors:0 dropped:0 overruns:0 carrier:0
          collisions:0 txqueuelen:0
          RX bytes:740660664181 (689.7 GiB)  TX bytes:740660664181 (689.7 GiB)

Getting started with Gearman

Gearman is an open source generic framework for distributed processing. At OSCON 2009 I attended the Gearman: Build Your Own Distributed Platform in 3 Hours tutorial.

While it’s very easy to install Gearman, and follow the first example, if you missed the all important additional PHP steps listed on just one slide you may be left with the “‘Class ‘GearmanClient’ not found” error.

The following are detailed instructions for the installation and configuration of Gearman and PHP on Ubuntu 9.04 Jaunty.

Add the Drizzle PPA to get pre-packaged versions of Gearman.

cp /etc/apt/sources.list /etc/apt/sources.list.orig
echo "deb http://ppa.launchpad.net/drizzle-developers/ppa/ubuntu intrepid main
deb-src http://ppa.launchpad.net/drizzle-developers/ppa/ubuntu intrepid main" >> /etc/apt/sources.list
apt-key adv --keyserver keyserver.ubuntu.com --recv-keys 06899068
apt-get update

Get the gearman packages

apt-get install -y gearman gearman-job-server gearman-tools libgearman1 libgearman-dev libgearman-dbg libgearman-doc

Get the German PHP extension.

wget http://pecl.php.net/get/gearman-0.4.0.tgz
tar xvfz gearman-0.4.0.tgz
cd gearman-0.4.0/
phpize
./configure
make
make install

If phpize is not available then you are missing the development packages.

$ apt get php5-dev

You also configure PHP to load the extension. This will vary on different Linux environments. In this case.

echo 'extension="gearman.so"' >>/etc/php5/cli/php.ini

Verify the PHP Gearman extension is configured.

$ php --info | grep gearman
gearman
gearman support => enabled
libgearman version => 0.8

Now you are ready for working with the Gearman PHP examples.

Setting up sysbench with MySQL & Drizzle

Sysbench is a open source product that enables you to perform various system benchmarks including databases. Drizzles performs regression testing of every trunk revision with a branched version of sysbench within Drizzle Automation.

A pending branch https://code.launchpad.net/~elambert/sysbench/trunk_drizzle_merge by Eric Lambert now enables side by side testing with MySQL and Drizzle. On a system running MySQL and Drizzle I was able install this sysbench branch with the following commands.

cd bzr
bzr branch lp:~elambert/sysbench/trunk_drizzle_merge
cd trunk_drizzle_merge/
./autogen.sh
./configure
make
sudo make install

Running the default lua tests supplied required me to ensure drizzle was in my path and that I created the ‘sbtest’ schema. I’ll be sure it add that checking to my future developed benchmark scripts.

$ cd sysbench/tests/db
$ sysbench --test=insert.lua --db_driver=drizzle prepare
sysbench v0.4.10:  multi-threaded system evaluation benchmark

FATAL: unable to connect to Drizzle server: 23
FATAL: error 0: Unknown database 'sbtest'
FATAL: failed to execute function `prepare': insert.lua:7: Failed to connect to the database
$ drizzle -e "create schema sbtest"
$ sysbench --test=insert.lua --db_driver=drizzle prepare
sysbench v0.4.10:  multi-threaded system evaluation benchmark

Creating table 'sbtest'...

And running produces the following results.

$ sysbench --num-threads=1 --test=insert.lua --db_driver=drizzle run
sysbench v0.4.10:  multi-threaded system evaluation benchmark

Running the test with following options:
Number of threads: 1

Threads started!

OLTP test statistics:
    queries performed:
        read:                            0
        write:                           10000
        other:                           0
        total:                           10000
    transactions:                        0      (0.00 per sec.)
    deadlocks:                           0      (0.00 per sec.)
    read/write requests:                 10000  (879.68 per sec.)
    other operations:                    0      (0.00 per sec.)

Test execution summary:
    total time:                          11.3678s
    total number of events:              10000
    total time taken by event execution: 11.3354s
    per-request statistics:
         min:                                  0.32ms
         avg:                                  1.13ms
         max:                                 68.74ms
         approx.  95 percentile:               2.41ms

Threads fairness:
    events (avg/stddev):           10000.0000/0.00
    execution time (avg/stddev):   11.3354/0.0

Rerunning the prepare also lacked some auto cleanup to allow for automated re-running.

$ sysbench --test=insert.lua --db_driver=drizzle prepare
Creating table 'sbtest'...
ALERT: Drizzle Query Failed: 1050:Table 'sbtest' already exists
FATAL: failed to execute function `prepare': insert.lua:57: Database query failed

For MySQL

$ sysbench --test=insert.lua --db_driver=mysql --mysql_table_engine=innodb prepare
sysbench v0.4.10:  multi-threaded system evaluation benchmark

Creating table 'sbtest'...

Unfortunately this doesn’t actually create the table in the right storage engine, I had to hack the code to ensure I was comparing InnoDB in each test.

$ sysbench --num-threads=1 --test=insert.l
ua --db_driver=mysql run
sysbench v0.4.10:  multi-threaded system evaluation benchmark

Running the test with following options:
Number of threads: 1

Threads started!

OLTP test statistics:
    queries performed:
        read:                            0
        write:                           10000
        other:                           0
        total:                           10000
    transactions:                        0      (0.00 per sec.)
    deadlocks:                           0      (0.00 per sec.)
    read/write requests:                 10000  (897.67 per sec.)
    other operations:                    0      (0.00 per sec.)

Test execution summary:
    total time:                          11.1399s
    total number of events:              10000
    total time taken by event execution: 11.1084s
    per-request statistics:
         min:                                  0.27ms
         avg:                                  1.11ms
         max:                                252.63ms
         approx.  95 percentile:               2.48ms

Threads fairness:
    events (avg/stddev):           10000.0000/0.00
    execution time (avg/stddev):   11.1084/0.00


Armed with a working environment I can now write some more realistic production like tests in Lua.

configure: error: mysql_config executable not found

If your compiling a product that includes a dependency of MySQL, you can easily get the error

configure: error: mysql_config executable not found

I generally don’t see this problem, because I use MySQL binary tar files, however if you use MySQL packages, such as Ubuntu, you can easily miss the required dependency.

My currently installed MySQL packages on this Ubuntu machine are:

$ sudo dpkg -l | grep mysql
ii  libdbd-mysql                               0.8.2-1-4.1                               MySQL database server driver for libdbi
ii  libdbd-mysql-perl                          4.008-1                                   A Perl5 database interface to the MySQL data
ii  libmysqlclient15off                        5.1.30really5.0.75-0ubuntu10.2            MySQL database client library
ii  libmysqlclient16                           5.1.31-1ubuntu2                           MySQL database client library
ii  libqt4-sql-mysql                           4.5.0-0ubuntu4.1                          Qt 4 MySQL database driver
ii  mysql-client-5.1                           5.1.31-1ubuntu2                           MySQL database client binaries
ii  mysql-common                               5.1.30really5.0.75-0ubuntu10.2            MySQL database common files
ii  mysql-server-5.1                           5.1.31-1ubuntu2                           MySQL database server binaries
ii  php5-mysql                                 5.2.6.dfsg.1-3ubuntu4.1                   MySQL module for php5

The missing link is the development version of the libmysqlclient library.

sudo apt-get install libmysqlclient15-dev

Understanding Different MySQL Index Implementations

It is important to know and understand that while indexing columns in MySQL will generally improve performance, using the appropriate type of index can make a greater impact on performance.

There are four general index types to consider when creating an appropriate index to optimize SQL queries.

  • Column Index
  • Concatenated Index
  • Covering Index
  • Partial Index

For the purpose of this discussion I am excluding other specialized index types such as fulltext, spatial and hash in memory engine.

Example Table

For the following examples, I will use this test table structure.

DROP TABLE IF EXISTS t1;
CREATE TABLE t1(
  id INT UNSIGNED NOT NULL AUTO_INCREMENT,
  user_name VARCHAR(20) NOT NULL,
  first_name VARCHAR(30) NOT NULL,
  last_name VARCHAR(30) NOT NULL,
  external_id INT UNSIGNED NOT NULL,
  country_id SMALLINT UNSIGNED NOT NULL,
  PRIMARY KEY(id)
) ENGINE=InnoDB;

Column Index

Quite simply, you have an index on a single column to help with performance. For example, if you were to query your data on external_id, without an index the system will need to read all data pages and then sequential scan pages to identify matching records. As there is no information known about how many rows satisfy the criteria, all data must be read. You can confirm this with the QEP.

SELECT id, user_name
FROM   t1
WHERE external_id = 1;

By adding an index to external_id, the query is optimized to only look at records that satisfy your criteria.

ALTER TABLE t1
  ADD INDEX (external_id);

Concatenated Index

I often see many single column indexes on tables, when these are simply not needed, and generally will be not used. This is easily identified when looking at the QEP and seeing multiple 3,4,5 possible keys.
You need to also consider in your MySQL Index theory, that in general only one index is used for each table in a MySQL query. There are a few exceptions however these are rare.

A concatenated index uses multiple columns. Let’s look a modified version of our query.

SELECT id, user_name
FROM   t1
WHERE external_id = 1
AND      country_id = 5;

The original external_id index will be used, however if we create a concatenated index on external_id and country_id we improve the query path.

ALTER TABLE t1
  DROP INDEX external_id,
  ADD INDEX (external_id, country_id);

What about an index on country_id, external_id? If your access to your data always includes these two columns, you can consider swapping the columns based on the cardinality. However, if you have queries that search on external_id or external_id and country_id, then creating an index on country_id, external_id will not be used.

Tip In the QEP look at the key length to determine how effective concatenated indexes are.

Covering Index

A covering index as the name describes covers all columns in a query. The benefit of a covering index is that the lookup of the various Btree index pages necessary satisfies the query, and no additional data page lookups are necessary.

If we revisit our earlier example, by modifying the external_id index, and create a concatenated index on external_id and user_name we actually satisfy

ALTER TABLE t1
  DROP INDEX external_id,
  ADD INDEX (external_id, user_name);
SELECT id, user_name
FROM   t1
WHERE external_id = 1;

With MySQL, the QEP will indicate in Extra, ‘Using Index’. This is not a reference to the index actually being used, but the index satisfies all requirements of the query.

Partial Index

The final type is the partial index. This is a MySQL feature which allows you specify a subset of a column for the index.

Let’s say we query data and allow pattern matching on last name.

SELECT id, first_name, last_name, user_name
FROM   t1
WHERE last_name like 'A%'

We should add an index to last_name to improve performance.

ALTER TABLE t1
  ADD INDEX (last_name);

Depending on the average length of data in last_name (you can use PROCEDURE ANALYSE as a quick tool to sample this), creating a partial index may greatly reduce the size of the index, and minimize the additional data lookups required.

ALTER TABLE t1
  DROP INDEX last_name,
  ADD INDEX (last_name(10));

In this example, you would want to investigate the size of the index, the improvement, and then the amount of additional reads necessary for sample queries. If your accessed data is generally hot, then the benefit of a smaller index will not be impacted by additional data seeks.

Conclusion

As with any performance tuning, sufficient analysis and before and after testing is necessary for your specific environment.

Some future topics on indexes not discussed here include:

  • Using UNIQUE Indexe
  • The impact of NULL columns and values on indexes
  • Eliminating filesort by using indexes
  • The affect of too many indexes
  • Index cardinality

You need to also consider in your MySQL Index theory, that in general only one index is used for each table in a MySQL query. There are a few exceptions however these are rare.

I common question I am also asked is about function based indexes? MySQL provides no means to use a scalar function against a column in an index.

What's new in MySQL 5.4.1

Absolutely nothing?

5.4.0 was released with a change in the MySQL Binary distributions, delivering only 1 64bit Linux platform and two Sun Solaris platforms. This was officially announced on April 21 2009 however the 5.4.0 Release Notes state 05 April 2009. So it’s not a big deal, but consistency would be nice.

I’ve seen in a few posts 5.4.1, so I decided to try it out. Spending the time to read what’s changed in 2 months with the 5.4.1 Release Notes before I go downloading and installing, you read.

This release does not differ from 5.4.0 except that binary distributions are available for all MySQL-supported platforms.

Is this going to be the new policy from Sun? Release for Solaris platforms first, then later release for other platforms?

What to do at 3:25am

Look at MySQL bug reports of course? Well actually I’m writing multiple blog posts, and I was confirming additional reference sources and links when I came across MySQL Bug #29847 – Large CPU usage of InnoDB crash recovery with a big buf pool.

Taking the time to actually read the information exchange I stumble upon.

[8 Jun 23:29] liz drachnik

Hello Heikki -

In order for us to continue the process of reviewing your contribution to MySQL - We need
you to review and sign the Sun|MySQL contributor agreement (the "SCA")

The process is explained here:

http://forge.mysql.com/wiki/Sun_Contributor_Agreement

Getting a signed/approved SCA on file will help us facilitate your contribution-- this
one, and others in the future.

Thank you !

Liz Drachnik  - Program Manager - MySQL

Oops. Well it made me laugh out loud for so many reasons. First your talking to the creator of InnoDB, a part of MySQL for at least 5+ years. Second, there is clearly an agreement between Oracle and MySQL already for the incorporation of InnoDB in the current builds, but mostly because at this late stage of probably Oracle acquisition (which side note has seemed too quite for too long) it seems rather a mute point to be chasing up paperwork.

Fortunately sanity obviously prevailed, unfortunately the public record persists. Still, humor is always good.

[9 Jun 18:04] Liz Drachnik

Please disregard the previous request for an SCA.
thank you

Never let your binlog directory fill up

Recently with a client while running a number of disaster recovery tests I came across a nasty situation which was not part of the original plan and provided a far worse disaster situation then expected.

I should preface this condition with some of the environment conditions.

  • MySQL 5.0 Enterprise 5.0.54
  • RHEL 5 64bit
  • Master and 2 Slaves
  • MySQL Data and MySQL Binary Logs/MySQL Error Logs are on separate disk partitions

While running stress tests under high load, we tested the filling of partition containing the logs. This partition included the binary log and MySQL error log.

The observed output was.

  • An error message was written to the MySQL error log. See below.
  • Application throughput dropped, but did not stop.
  • Binary logs stopped occurring.
  • MySQL proactively stopped logging but continued to process transactions.

The end result was:

  • The error log was ultimately truncated after reboot, so if the information was not captured while this was in action, this important messages would be lost.
  • The primary slave used for read scalability and the secondary slave used for backups are now unusable.
  • The backup and recovery process using slaves and point in time recovery via binary logs is not unusable.
  • The three backup methods in use for the client are ineffective. It was necessary to disable access to the Master, take a full backup, and then sync the slaves from this copy.
090710 19:01:25 [ERROR] /opt/mysql/bin/mysqld: Disk is full writing '/mysqllog/binlog/hostname-3306-bin.000020'
     (Errcode: 28). Waiting for someone to free space... Retry in 60 secs
090710 19:01:46 [ERROR] Error writing file '/mysqllog/slow_log/hostname_3306_slow_queries.log' (errno: 1)
090710 19:02:25 [ERROR] Error writing file '/mysqllog/binlog/hostname-3306-bin' (errno: 28)
090710 19:02:25 [ERROR] Could not use /mysqllog/binlog/hostname-3306-bin for logging (error 28).
    Turning logging off for the whole duration of the MySQL server process. 
    To turn it on again: fix the cause, shutdown the MySQL server and restart it.

Updated

I discuss in detail the options for the MySQL error log including recommendations for the MySQL error log file location in Monitoring MySQL – The error log

Getting wireless working on Ubuntu Macbook

I run Ubuntu 9.04 Januty on my Macbook. Previously installing Ubuntu 8.10, wireless worked automatically, for 9.04 it did not.

This is what I did to fix it.

  1. Verify your Macbook is seeing the Broadcom controller. See below for the lspci command, and expected output.
  2. Goto System -> Administration -> Hardware Drivers. The Broadcom STA wireless driver is activated, deactivate it.
  3. Add to /etc/modules a line with wl
  4. Reboot
  5. Goto System -> Administration -> Hardware Drivers. Activate the Broadcom STA wireless driver.
  6. Reboot
  7. Wireless now operational.
$ lspci
...
02:00.0 Network controller: Broadcom Corporation BCM4328 802.11a/b/g/n (rev 03)
03:00.0 Ethernet controller: Marvell Technology Group Ltd. Marvell Yukon 88E8058 PCI-E Gigabit Ethernet Controller (rev 13)
04:03.0 FireWire (IEEE 1394): Agere Systems FW323 (rev 61)

For reference, modprobe wl does not return any output in my environment, yet wireless works fine.

References:

Understanding more InnoDB MVCC

As I had written earlier in Understanding InnoDB MVCC, I am trying to understand why InnoDB is taking a lock on data during an UPDATE when I do not expect this to happen.

Not wanting to go looking at the InnoDB source code to understand the problem, I’m endeavouring to possibly use existing MySQL monitoring to try and understand the problem better. In this case, I’m going to investigate SHOW ENGINE INNODB STATUS first. An old but still relevant article for reference is SHOW INNODB STATUS walk through. The MySQL High Performance book is also a good starting reference.

I’ve just installed 5.1.36 on a new Linux 64 bit laptop for this test.

For now all I’ve done is ensure the innodb_buffer_pool_size is sufficient to hold the entire table in memory.

So what happens in the 21.5 seconds these queries took to run.

–thread 1

mysql> start transaction;
Query OK, 0 rows affected (0.00 sec)

mysql> update numbers
    -> set f2 = f2 +200
    -> where id between 1 and 1000000; commit;
Query OK, 1000000 rows affected (21.50 sec)
Rows matched: 1000000  Changed: 1000000  Warnings: 0
Query OK, 0 rows affected (0.02 sec)

–thread 2

Query OK, 0 rows affected (0.00 sec)

mysql> update numbers
    -> set f2 = f2 +300
    -> where id between 1000001 and 2000000; commit;
Query OK, 1000000 rows affected (20.06 sec)
Rows matched: 1000000  Changed: 1000000  Warnings: 0
Query OK, 0 rows affected (0.02 sec)

In SHOW ENGINE INNODB STATUS I sampled 1718 unique times. Probably not the best approach but it did highlight some things.

The overall state of the main Innodb thread process cycled though states including sleeping, making checkpoint, flushing log, waiting for server activity, purging and reserving kernel mutex.

     49 Main thread process no. 5489, id 139872150796624, state: flushing log
    709 Main thread process no. 5489, id 139872150796624, state: making checkpoint
      1 Main thread process no. 5489, id 139872150796624, state: purging
      2 Main thread process no. 5489, id 139872150796624, state: reserving kernel mutex
    956 Main thread process no. 5489, id 139872150796624, state: sleeping
      1 Main thread process no. 5489, id 139872150796624, state: waiting for server activity

I was surprised to see making checkpoint here. I’ve actually run this monitoring on two separate servers, both running 5.1.x and both times this occured. On this test machine, I also saw an increase in the flush list, and pending checkpoint writes to confirm this. I’ve tried in the past to monitor this closely, so this test actually will be useful for a different problem analysis at a later time.

Some 3800 OS Waits (that’s context switches) indicates some critical code need to use a mutex. These mutexes listed in the Semaphores section occured in multiple areas including:

      4 Mutex at 0x1684b08 created file mem/mem0pool.c line 206, lock var 0
     61 Mutex at 0x7f369033e2b8 created file srv/srv0srv.c line 875, lock var 0
      1 Mutex at 0x7f36903408b8 created file fil/fil0fil.c line 1313, lock var 1
     22 Mutex at 0x7f3690340cb8 created file buf/buf0buf.c line 597, lock var 0
      5 Mutex at 0x7f36903410e0 created file btr/btr0sea.c line 139, lock var 0
      1 Mutex at 0x7f36903410e0 created file btr/btr0sea.c line 139, lock var 1
     21 Mutex at 0x7f3690341910 created file log/log0log.c line 738, lock var 0
     85 Mutex at 0x7f3690341910 created file log/log0log.c line 738, lock var 1
      8 Mutex at 0x7f36903508c0 created file trx/trx0rseg.c line 147, lock var 0
    232 Mutex at 0x7f36903508c0 created file trx/trx0rseg.c line 147, lock var 1

One transaction waited only a little more then 1 second, indicated by 58 samples.

---TRANSACTION 0 1327, ACTIVE 22 sec, process no 5489, OS thread id 139872177113424 fetching rows
mysql tables in use 1, locked 1
LOCK WAIT 2008 lock struct(s), heap size 292848, 1002005 row lock(s), undo log entries 1000000
MySQL thread id 66, query id 11435 localhost root Updating
update numbers
set f2 = f2 +200
where id between 1 and 1000000
------- TRX HAS BEEN WAITING 1 SEC FOR THIS LOCK TO BE GRANTED:
RECORD LOCKS space id 0 page no 2612 n bits 568 index `PRIMARY` of table `test`.`numbers` trx id 0 1327 lock_mode X waiting
Record lock, heap no 256 PHYSICAL RECORD: n_fields 5; compact format; info bits 0
 0: len 4; hex 000f4241; asc   BA;; 1: len 6; hex 000000000530; asc      0;; 2: len 7; hex 00000000f20110; asc        ;; 3: len 4; hex 800f4241; asc   BA;; 4: len 4; hex 8005032c; asc    ,;;

And the blocker in this instance while waiting for this lock to be released was continuing to get row locks, and create undo log entries. That was to be expected.

963 lock struct(s), heap size 292848, 979851 row lock(s), undo log entries 977891
1979 lock struct(s), heap size 292848, 988001 row lock(s), undo log entries 986025
1989 lock struct(s), heap size 292848, 993013 row lock(s), undo log entries 991027

I doubled checked to ensure no other queries were inside the InnoDB queue.

      4 0 queries inside InnoDB, 0 queries in queue
    303 1 queries inside InnoDB, 0 queries in queue
   1411 2 queries inside InnoDB, 0 queries in queue

Only 12 of the 1718 samples showed any Pending asynchronous I/O writes, however there was a higher amount of pending buffer pool and log syncs. This is all to be expected.

This quick inspection, especially at 1am has not given me any answers. With greater information, the need for better understanding is required.

Killing my softly with QUERY

The MySQL KILL command as the name suggests kills queries that are running.

After identifying the Id using the SHOW PROCESSLIST command, the User of the connection/thread or a database user with SUPER privileges can execute KILL [id]; to remove the connection/thread.

However, there is an ability to kill just the query that is being executed rather the entire connection. The default when not specified is to kill the connection, however you can optional specify the CONNECTION or QUERY keywords.

For example, below is an interactive test.

Thread 1:

mysql> select sleep(10);

Thread 2:

mysql> show processlist;
+----+------+-----------+------+---------+------+-----------+------------------+
| Id | User | Host      | db   | Command | Time | State     | Info             |
+----+------+-----------+------+---------+------+-----------+------------------+
| 23 | root | localhost | NULL | Query   |    2 | executing | select sleep(10) |
| 24 | root | localhost | NULL | Query   |    0 | NULL      | show processlist |
+----+------+-----------+------+---------+------+-----------+------------------+
2 rows in set (0.00 sec)

mysql> kill query 23;

Thread 1:
Notice, the query exits, in less then 10 seconds, but the connection is still valid.

+-----------+
| sleep(10) |
+-----------+
|         1 |
+-----------+
1 row in set (7.27 sec)

mysql> select sleep(10);

Thread 2:

mysql> show processlist;
+----+------+-----------+------+---------+------+-----------+------------------+
| Id | User | Host      | db   | Command | Time | State     | Info             |
+----+------+-----------+------+---------+------+-----------+------------------+
| 23 | root | localhost | NULL | Query   |    4 | executing | select sleep(10) |
| 24 | root | localhost | NULL | Query   |    0 | NULL      | show processlist |
+----+------+-----------+------+---------+------+-----------+------------------+
2 rows in set (0.00 sec)

mysql> kill 23;
Query OK, 0 rows affected (0.00 sec)

Thread 1:
Query is killed and connection is lost. An attempt to run the command again within the interactive client causes the system to re-get a connection.

ERROR 2013 (HY000): Lost connection to MySQL server during query
mysql> select sleep(10);
ERROR 2006 (HY000): MySQL server has gone away
No connection. Trying to reconnect...
Connection id:    25
Current database: *** NONE ***

+-----------+
| sleep(10) |
+-----------+
|         0 |
+-----------+
1 row in set (10.00 sec)

Installing Perl RRD module – RRDs.pm

Perform a quick check if the module is available.

$ perl -MRRDs -le 'print q(ok!)'
Can't locate RRDs.pm in @INC (@INC contains: /usr/lib64/perl5/site_perl/5.8.8/x86_64-linux-thread-multi /usr/lib64/perl5/site_perl/5.8.7/x86_64-linux-thread-multi /usr/lib64/perl5/site_perl/5.8.6/x86_64-linux-thread-multi /usr/lib64/perl5/site_perl/5.8.5/x86_64-linux-thread-multi /usr/lib/perl5/site_perl/5.8.8 /usr/lib/perl5/site_perl/5.8.7 /usr/lib/perl5/site_perl/5.8.6 /usr/lib/perl5/site_perl/5.8.5 /usr/lib/perl5/site_perl /usr/lib64/perl5/vendor_perl/5.8.8/x86_64-linux-thread-multi /usr/lib64/perl5/vendor_perl/5.8.7/x86_64-linux-thread-multi /usr/lib64/perl5/vendor_perl/5.8.6/x86_64-linux-thread-multi /usr/lib64/perl5/vendor_perl/5.8.5/x86_64-linux-thread-multi /usr/lib/perl5/vendor_perl/5.8.8 /usr/lib/perl5/vendor_perl/5.8.7 /usr/lib/perl5/vendor_perl/5.8.6 /usr/lib/perl5/vendor_perl/5.8.5 /usr/lib/perl5/vendor_perl /usr/lib64/perl5/5.8.8/x86_64-linux-thread-multi /usr/lib/perl5/5.8.8 .).
BEGIN failed--compilation aborted.

Check the installed packages on this CentOS 5 server.

$ rpm -qa | grep rrd
rrdtool-1.2.27-3.el5

Do a search for related rrdtool modules.

$ sudo yum search rrdtool
Loading "fastestmirror" plugin
Loading mirror speeds from cached hostfile
 * epel: ftp.SURFnet.nl
 * base: mirrors.service.softlayer.com
 * updates: mirrors.service.softlayer.com
 * addons: mirrors.service.softlayer.com
 * extras: mirrors.service.softlayer.com
Excluding Packages in global exclude list
Finished
rrdtool.i386 : Round Robin Database Tool to store and display time-series data
queuegraph.noarch : A RRDtool frontend for Mail statistics
rrdtool-perl.x86_64 : Perl RRDtool bindings
rrdtool-tcl.x86_64 : Tcl RRDtool bindings
mailgraph-selinux.noarch : A RRDtool frontend for Mail statistics
collectd-rrdtool.x86_64 : RRDTool module for collectd
rrdtool.i386 : Round Robin Database Tool to store and display time-series data
munin.noarch : Network-wide graphing framework (grapher/gatherer)
rrdtool.x86_64 : Round Robin Database Tool to store and display time-series data
ruby-RRDtool.x86_64 : RRDTool for Ruby
munin-node.noarch : Network-wide graphing framework (node)
rrdtool-ruby.x86_64 : Ruby RRDtool bindings
sagator.noarch : Antivir/antispam gateway for smtp server
rrdtool-php.x86_64 : PHP RRDtool bindings
rrdtool-devel.x86_64 : RRDtool libraries and header files
rrdtool-python.x86_64 : Python RRDtool bindings
ganglia-gmetad.x86_64 : Ganglia Metadata collection daemon
rrdtool-doc.x86_64 : RRDtool documentation
cacti.noarch : An rrd based graphing tool
queuegraph-selinux.noarch : A RRDtool frontend for Mail statistics
rrdtool-devel.i386 : RRDtool libraries and header files
cacti.noarch : An rrd based graphing tool
sysusage.noarch : System monitoring based on perl, rrdtool, and sysstat
mailgraph.noarch : A RRDtool frontend for Mail statistics
rrdtool.x86_64 : Round Robin Database Tool to store and display time-series data

Install what looks like the right module.

$ sudo yum install rrdtool-perl
Loading "fastestmirror" plugin
Loading mirror speeds from cached hostfile
 * epel: mirrors.ircam.fr
 * base: mirrors.service.softlayer.com
 * updates: mirrors.service.softlayer.com
 * addons: mirrors.service.softlayer.com
 * extras: mirrors.service.softlayer.com
Excluding Packages in global exclude list
Finished
Setting up Install Process
Parsing package install arguments
Resolving Dependencies
--> Running transaction check
---> Package rrdtool-perl.x86_64 0:1.2.27-3.el5 set to be updated
--> Finished Dependency Resolution

Dependencies Resolved

=============================================================================
 Package                 Arch       Version          Repository        Size
=============================================================================
Installing:
 rrdtool-perl            x86_64     1.2.27-3.el5     epel               34 k

Transaction Summary
=============================================================================
Install      1 Package(s)
Update       0 Package(s)
Remove       0 Package(s)

Total download size: 34 k
Downloading Packages:
(1/1): rrdtool-perl-1.2.2 100% |=========================|  34 kB    00:00
Running rpm_check_debug
Running Transaction Test
Finished Transaction Test
Transaction Test Succeeded
Running Transaction
  Installing: rrdtool-perl                 ######################### [1/1]

Installed: rrdtool-perl.x86_64 0:1.2.27-3.el5
Complete!

Test shows it should now be available.

$ perl -MRRDs -le 'print q(ok!)'
ok!

Verifying MySQL Replication in action

There is a very simple test to show MySQL replication in action and to also better understand the basics of MySQL Replication. With a configured MySQL environment we can run the following test on your MySQL master, and monitor the MySQL slave.

If you would like to try this, you can use MySQL SandBox which can launch a MySQL Master/Slave configuration in seconds. You can get started with MySQL Sandbox and Download 3.0.04.

Sandbox setup

$ make_replication_sandbox ~/mysql/mysql-5.1.35-osx10.5-x86.tar.gz
$ cd ~/sandboxes/rsandbox_5_1_35/

On the master

We will use a modified version of the numbers procedure found at Filling test tables quickly as our test program.

./m
create schema if not exists test;
use test
drop table if exists numbers;
create table numbers (id int unsigned not null primary key);

delimiter $$

drop procedure if exists fill_numbers $$
create procedure fill_numbers(in p_max int)
deterministic
begin
  declare counter int default 1;
  truncate table numbers;
  insert into numbers values (1);
  while counter < p_max
  do
      insert into numbers (id)
          select id + counter
          from numbers;
      select count(*) into counter from numbers;
      select counter;
  end while;
end $$
delimiter ;

call fill_numbers(2000000);

On the slave

$ watch -n 1 --differences './s2 -e "SHOW SLAVE STATUSG"'

This simple command monitors the replication process dynamically and gives a highlighted output during the process. You will notice different highlighted sections during various stages of the replication process.

The output will look similar to:

*************************** 1. row ***************************
               Slave_IO_State: Waiting for master to send event
                  Master_Host: 127.0.0.1
                  Master_User: msandbox
                  Master_Port: 23150
                Connect_Retry: 60
              Master_Log_File: mysql-bin.000001
          Read_Master_Log_Pos: 4586
               Relay_Log_File: mysql_sandbox23152-relay-bin.000029
                Relay_Log_Pos: 251
        Relay_Master_Log_File: mysql-bin.000001
             Slave_IO_Running: Yes
            Slave_SQL_Running: Yes
              Replicate_Do_DB:
          Replicate_Ignore_DB:
           Replicate_Do_Table:
       Replicate_Ignore_Table:
      Replicate_Wild_Do_Table:
  Replicate_Wild_Ignore_Table:
                   Last_Errno: 0
                   Last_Error:
                 Skip_Counter: 0
          Exec_Master_Log_Pos: 4586
              Relay_Log_Space: 564
              Until_Condition: None
               Until_Log_File:
                Until_Log_Pos: 0
           Master_SSL_Allowed: No
           Master_SSL_CA_File:
           Master_SSL_CA_Path:
              Master_SSL_Cert:
            Master_SSL_Cipher:
               Master_SSL_Key:
        Seconds_Behind_Master: 0
Master_SSL_Verify_Server_Cert: No
                Last_IO_Errno: 0
                Last_IO_Error:
               Last_SQL_Errno: 0
               Last_SQL_Error:

The value of multi insert values

Baron got a great amount of response from his 50 things to know before migrating Oracle to MySQL. I’m glad I invited him as a fellow MySQL colleague to my presentation to the Federal Government on Best Practices for Migrating to MySQL from Oracle and SQL Server for his inspiration.

Oracle will always be a more featured product then MySQL. There are however features that MySQL has that Oracle does not. While I’ve got a draft of a list of my own, I have several hundred incomplete drafts.

One of these features I was able to demonstrate to a client is the ability to have multiple VALUES clauses for a single INSERT statement. For example.

INSERT INTO t1(c1) VALUES (1), (2), (3), (4), (5);

Instead of

INSERT INTO t1(c1) VALUES(1);
INSERT INTO t1(c1) VALUES(2);
INSERT INTO t1(c1) VALUES(3);
INSERT INTO t1(c1) VALUES(4);
INSERT INTO t1(c1) VALUES(5);

Does it make a difference? What is the performance improvement?

The number one reason for an improvement in performance is the lack of network latency for each command. We ran a number of tests in a specific example for the client, taking multiple single insert statements, and combining into combined statements.

We ran tests across localhost and also a network test.

It was found that taking several thousand INSERT queries and combined into a maximum of 1M packets made sense. Overall this single test showed a 88% improvement from 11.4 seconds to 1.4 seconds.

real        0m11.403s
user        0m0.175s
sys         0m0.157s

real        0m1.415s
user        0m0.019s
sys         0m0.012s

In the real world example, differences in the volumes of query to combine and system load showed a reduction of 72%

O'Reilly Twitter Boot Camp a success

The first O’Reilly Twitter Boot Camp#OTBC was held in New York as a pre cursor to 140 Characters Conference#140conf on Monday 15th June, 2009.

With opening and closing keynotes were like matching bookends of The Twitter Book #twitterbook offered to all attendees and authored by the keynoters @timoreilly and @SarahM.

Attendees came from across the country. Just a few I spoke with coming from LA – @EricMueller of @FLWbooks, Texas – @marlaerwin , Vancouver – HootSuite, Las Vegas -zappos, Boston – @mvolpe , Philadelphia, @SBrownCCI from Cincinnati and @sticky_mommy from Vermont.

The demographics of attendees was a little different from my usual O’Reilly conferences of MySQL, OSCON and Web 2.0. There were less the half the attendees with laptops at hand for notes & twittering, offset by the high blackberry or should I say shaq-berry users (Thanks Ami @digitalroyalty), easily seen from the back of the steep and dark auditorium. A greater proportion of different industries and gender lead to many questions and discussions from users, not just technologists.

The morning panel sessions afforded no question time due to speakers providing good but overtime content. Over lunch Mike Volpe of HubSpot a corporate sponsor for the day set the standard by asking his panel of speakers to stick on time. This afforded almost 30 minutes of question time and a roar of approval from the crowd.

There is a lot of valuable information you can find by Twitter Search of #OTBC. A few examples include:

  • @archivesnext: Good advice: RT @mpedson RT @timoreilly: Twitter usage policy from @zappos at #OTBC: “Just be real and use your best judgement.”
  • @GeekGirlCamp: Hmmmm. Lots of conflicting views on following on Twitter here. What makes YOU follow someone? Would love to know… #OTBC
  • @CarriBugbee: ROI is a tricky thing on twitter; if you’re using it solely to generate revenue, you might be there for the wrong reason – @wholefoods #otbc
  • @mvolpe: “Driving ROI on Twitter” slides and video of my presentation later today for #OTBC – http://tinyurl.com/061509mvolpe
  • @ronaldbradford: Best Practices for Twitter – Build a commercial-grade profile. @CarriBugbee at #OTBC
  • @journalismgal: Ask questions within your tweets even something as simple as your fab apple #otbc
  • @ronaldbradford: Do stay tuned in. Nights, weekends, holidays are all twitter time. Maria Erwin @wholefoods at #OTBC
  • @harrybrelsford: Is Twitter the new Google? That is belief of @erictpeterson Twitter is creating entire new businesses (Flash Light books) #otbc #smbnation

My individual brands of @ronaldbradford and @MySQLExpert will certainly benefit from a wealth of knowledge of the day. If only I had my Twitter name on the tee shirt I was wearing for the event.

The only down sides to the venue the lack of power for attendees, flaky Internet and a basement auditorium with no cell phone service. Important things to re-consider for a online technology conference. In true form the attendees including myself @ronaldbradford, @SBrownCCI, @GeekGirlCamp, @14str8 used the medium of the conference and our voices were heard and some limited power made available. Thanks O’Reilly for listening.

Thank you to all speakers @katmeyer, @timoreilly, @steverubel, @zappos, @carribugbee, @twittermoms, @flwbooks, @davidjdeal, @bethharte, @dunkindonuts, @reggiebradford, @wholefoods, @tedmurphy, @adbroad, @digitalroyalty, @erictpeterson, @mvolpe, @laureltouby, @sarahm and to Zappos.com for the after event happy hour.

Wafflecloud with cream

I have been working recently with Matt Yonkovit to get Waffle Grid cloud enabled with Amazon Web Services (AWS).

An initial version of Waffle Grid Cream – Version 0.5 release is now available.

We have elected to create one AMI for now, that is ready to be configured as either a MySQL Server, a memcached server, or as in the following example both. For this first version, we have also not configured MySQL or memcache, but rather provide a virgin Waffle Grid ready server for developers to experiment and benchmark with.

Future releases will include custom AMI’s and the automated ability to register new memcached servers with the Waffle Grid enabled MySQL server.

Instance Creation

We assume you have created an EC2 account and are using one of the many tools available to launch images.

The AMI you want to launch is ami-0575936c. This is an Ubunut Intrepid 8.10 32bit small instance, and includes MySQL 5.4.0 beta and Memcache 1.4.0 RC1.

Configuration

$ ssh -i [key] ubuntu@ec2-[hostname]
$ ps -ef | grep -e "mysql" - "memcached"
$ memcached -m 1024 -p 11211 -u nobody -l 127.0.0.1 -d
$ memstat -s localhost
$ sudo /etc/init.d/mysql start

Verification

$ mysql -uroot -e "SELECT VERSION"
$ mysql -uroot -e "SHOW ENGINE INNODB STATUSG"

The Innodb Status shows a new section.

---------
MEMCACHED
---------
Memcached puts    0
Memcached hits    0
Memcached misses  0
Memcached Prefix:  3576

Testing

$ mysql -uroot -e "SELECT COUNT(*) FROM sakila.actor"
$ mysql -uroot -e "SHOW ENGINE INNODB STATUSG"
$ memcached -s localhost

Verification will show the change of information in the INNODB STATUS output.

---------
MEMCACHED
---------
Memcached puts    4
Memcached hits    0
Memcached misses  4
Memcached Prefix:  3576
Memcached Miss Total Lat 103 (us)
Memcached Miss Recent Lat 103 (us)
Memcached Set Total Lat 760 (us)
Memcached Set Recent Lat 760 (us)

You can also confirm stats in memcached.

$memstat -s localhost
Listing 1 Server

Server: localhost (11211)
        pid: 3453
        uptime: 575
        time: 1245013741
        version: 1.4.0-rc1
        pointer_size: 32
        rusage_user: 0.0
        rusage_system: 0.0
        curr_items: 5
        total_items: 5
        bytes: 82265
        curr_connections: 6
        total_connections: 9
        connection_structures: 7
        cmd_get: 4
        cmd_set: 5
        get_hits: 0
        get_misses: 4
        evictions: 0
        bytes_read: 82265
        bytes_written: 82265
        limit_maxbytes: 1073741824
        threads: 5

multi-threaded memcached

I discovered while compiling Wafflegrid today that by default, the Ubuntu binaries for memcached are not-multithreaded.

Following the installation of memcached from apt-get and libmemcached I ran memslap for:

$ memslap -s localhost
    Threads connecting to servers 1
    Took 1.633 seconds to load data

$ memstat -s localhost
Listing 1 Server

Server: localhost (11211)
     pid: 23868
     uptime: 54
     time: 1244575816
     version: 1.2.2
     pointer_size: 32
     rusage_user: 0.90000
     rusage_system: 0.120000
     curr_items: 10000
     total_items: 10000
     bytes: 5430000
     curr_connections: 1
     total_connections: 3
     connection_structures: 2
     cmd_get: 0
     cmd_set: 10000
     get_hits: 0
     get_misses: 0
     evictions: 0
     bytes_read: 5430000
     bytes_written: 5430000
     limit_maxbytes: 0
     threads: 1

By installed the Latest RC 1.4.0 we see.

memslap -s localhost
    Threads connecting to servers 1
    Took 0.866 seconds to load data

memstat -s localhost

Listing 1 Server

Server: localhost (11211)
     pid: 8651
     uptime: 375
     time: 1244577237
     version: 1.4.0-rc1
     pointer_size: 32
     rusage_user: 0.110000
     rusage_system: 0.130000
     curr_items: 10000
     total_items: 10000
     bytes: 5510000
     curr_connections: 5
     total_connections: 8
     connection_structures: 6
     cmd_get: 0
     cmd_set: 10000
     get_hits: 0
     get_misses: 0
     evictions: 0
     bytes_read: 5510000
     bytes_written: 5510000
     limit_maxbytes: 0
     threads: 5

Thanks Matt for pointing that one out.