Many application developers would know of New Relic. A SaaS performance and monitoring tool targeted towards your web application monitoring including PHP, Ruby, Java, .Net, Python and Node.
With the release today (June 19, 2013) of the New Relic Platform, custom monitoring of data stores including MySQL are now possible. Try it now free. This link will provide you a free standard account (no cost, no billing details necessary), that enables you to perform application monitoring, server monitoring, MySQL instance monitoring and monitoring of many other products via many plugins.
Over the next few posts I will be discussing some of the design decisions I made for this MySQL plugin. New Relic has certain features that lend towards really helping developers monitor and diagnose the application (I have been surprised how it has helped in debugging DB and OS problems directly from PHP code for example). However, often it’s important that knowing the server resources, the database usage is critical to seeing the whole picture, and with the new plugins, New Relic gives developers, system administrators and database administrator some well targeted insights. When building custom dashboards you can see CPU usage, Database usage, and your web application volume, page load time and other metrics on one page.
The MySQL plugin has two pre-requisite requirements. A MySQL server running 5.0 or better, and a Java JRE 1.6 or better. The plugin can work either directly on each MySQL server/instance, and therefore needs the JRE, or it is possible to configure a single server to collect all MySQL statistics and report them to New Relic. There are no specifics that restrict this plugin working for any MySQL variants/forks, infact I specifically designed the plugin to be forward compatible with new version and status variables for example, and support custom recording of any metrics (more on that later).
This is first release of the New Relic Platform and MySQL plugin so I expect a lot of refinements, improvements and suggestions as we move forward. As an integral part of developing the MySQL plugin and using the New Relic Java SDK, there are a number of roadmap items to better serve MySQL and other products that will be coming in future releases. The beta version of the MySQL plugin has been running on production MySQL servers for several months now and working well.
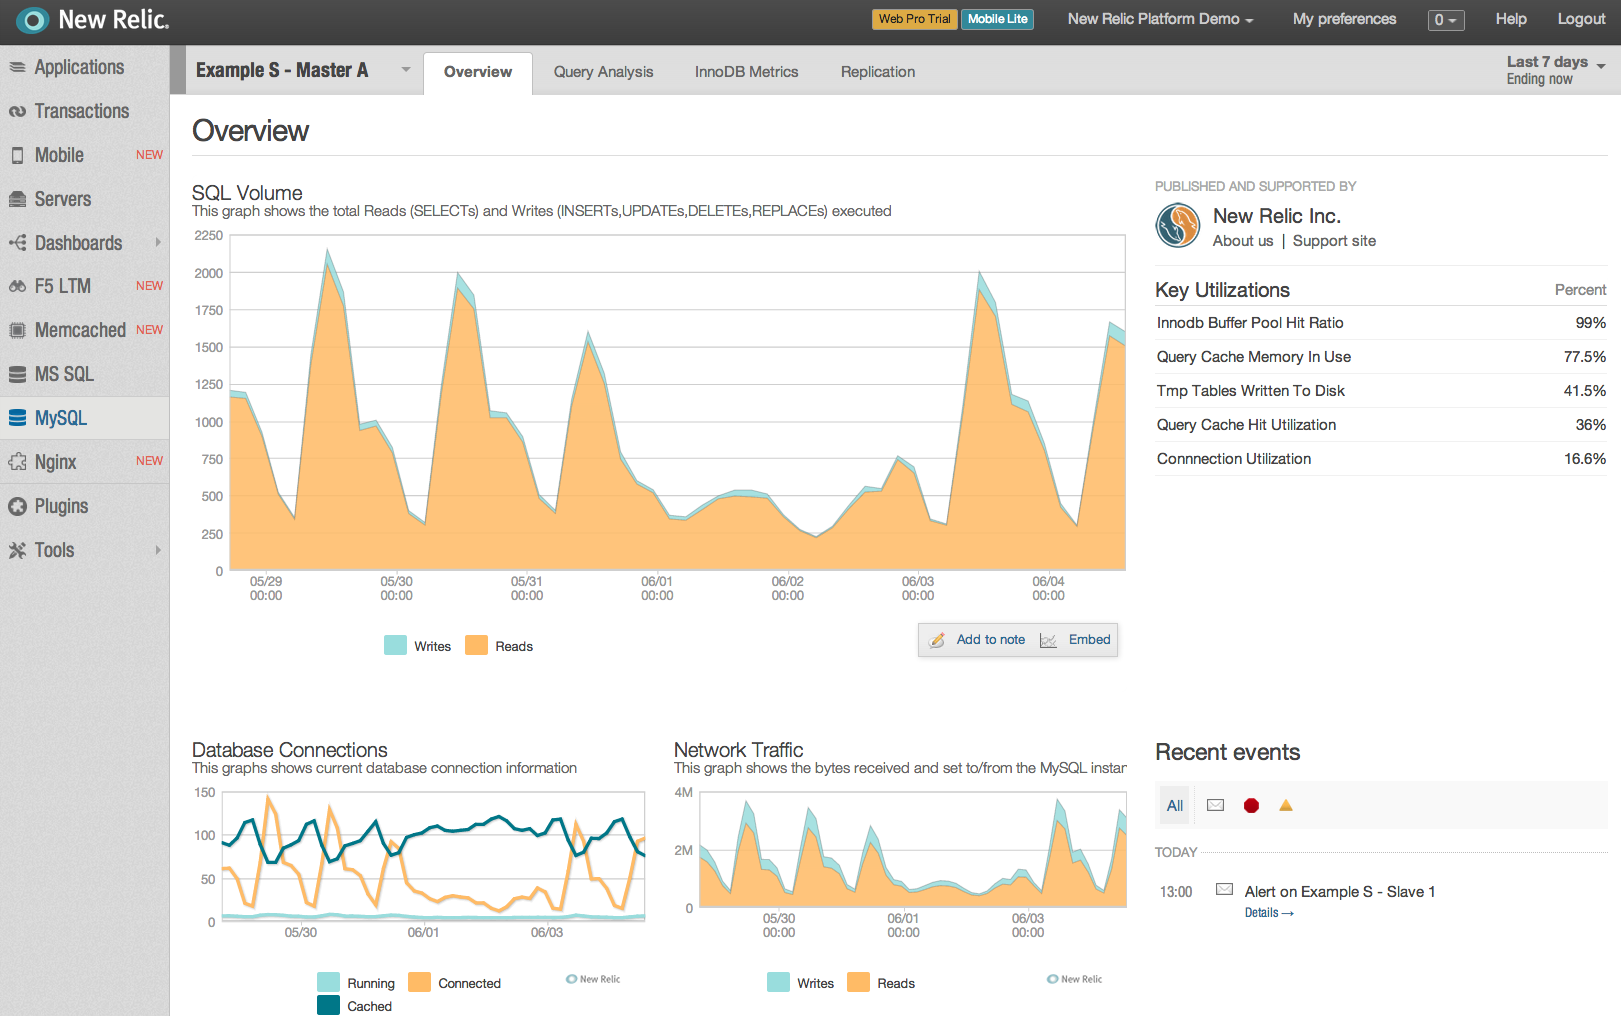
New Relic provides two ways to display data, first by graphs, and second by tables. There is a handy information option in the Server monitoring that is not presently available for the plugins. Graphs work best with multiple data points and constantly changing data and records averages. When looking at the SQL commands for example is great to see the total breakdown, monitoring MySQL replication lag (a single metric), that hopefully is generally zero can appear a little bland. A cool trick is to click on the legend, this toggles the displayed value, and can really help when one value in a graph hogs the metric.
At present the plugin has 4 tabs of display:
- Overview provides a high level view of total reads v total writes, database connections, network communications and a table of key utilizations (which I will discuss more in another post)
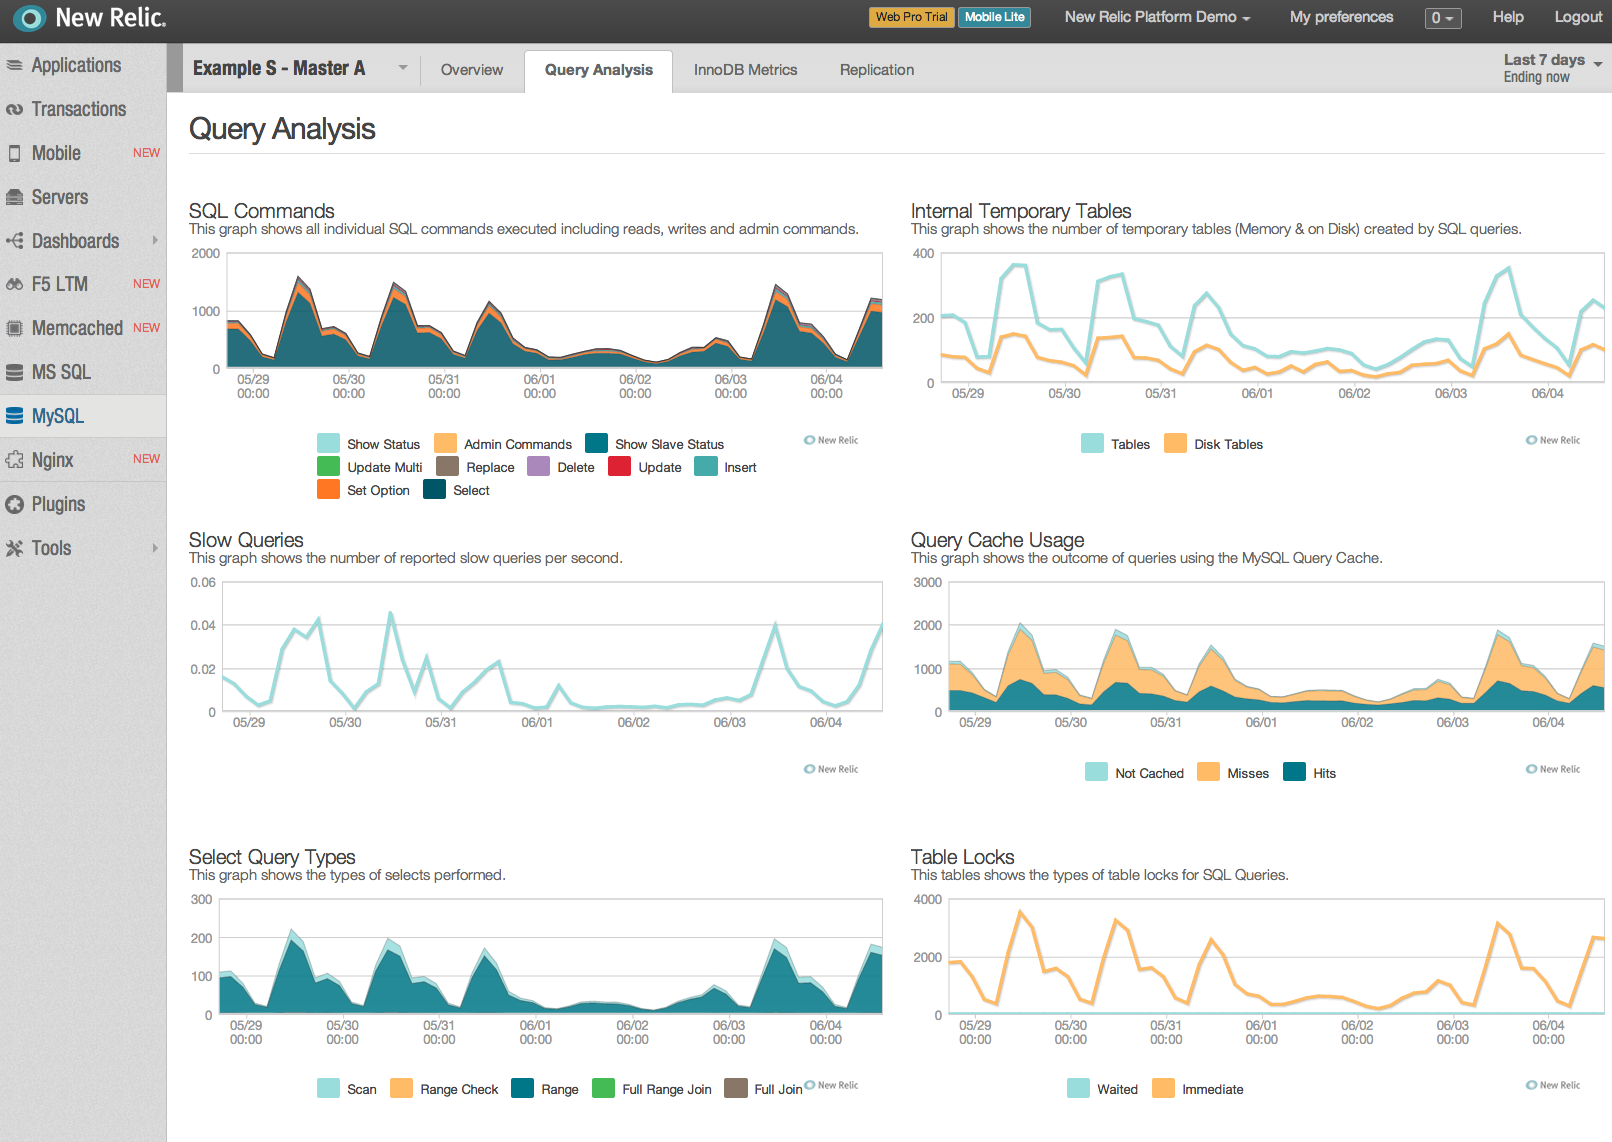
- Query Analysis shows details of SQL commands, temporary (memory/disk) tables, slow queries, query cache usage, select query types, sort types and table locking.
- InnoDB Metrics include buffer pool operations, a page breakdown, row operations, log writes, log and data fsyncs, checkpoint age, history list, internal threads and mutexes.
- Replication shows lag, relay log volume, I/O thread lag, slave errors and master binary log volume (when on a master).
The plugin is written to be extensible via JSON configuration. Those wishing to monitor different variables, or say custom metrics from storage engines like Tokutek can be easily defined, either a key/value set, or single row of metrics. However, the initial version of the dashboards does not allow the customers to modify the present dashboard. Requests are welcome for me to expand the current global dashboards.