What is testing?

In software development this is a simple question. What is [the purpose of] testing? If asked to give a one sentence answer what would you say? I have asked this simple question of attendees at many presentations, and also to software developers I have worked with or consulted to.

The most common answer is. “Testing is about making sure the software works, the function your testing does what it should, for example saves the information you entered”.

Unfortunately this is not the purpose of testing, and this attitude leads to what I generally term as poor quality software. “Testing is about trying to break your product any way possible, all the time.”

With this clarification in understanding of a basic and necessary software engineering principle, the attitude towards software development and the entire focus and mindset of engineering and quality assurance can change for the better.

Another very simple example which I often ask when consulting. What does your website look like when it’s down? Again, the general answer is often vague and/or incomplete. How do you know when your website is down? I have heard the response “The users will let you know”. You may laugh, but it is certainly not funny. Show me your website in a down state? Show me your website in a degraded state? When the answer is either unclear, or with a recent employment the same response, there has simply been little thought into producing a quality product by a testing process that is intent on breaking your software.

What procedures do you follow when receiving alerts about errors? What procedures do you put in place to ensure they do not happen again? Again, one has to be disappointed when the response is, “I will set up an email alert to the team for this type of error?” This reactive response is not addressing the problem, only acknowledging the existence of a problem. What is needed is being proactive. Was a bug raised? Can the problem be easily reproduced? How was the problem fixed the first time? Can this be corrected in the code? Can the interim resolution be automated?

When there is a negative user experience from any type of failure or error another important feedback loop is the post-mortem to review the when, why, how and who of the situation and to create a plan to ensure this does not happen again.

Testing needs to baked in to everything that is done, and practice makes for a more perfect outcome. In a high volume environment it is critical to have a simulated environment where you can benchmark performance of any new release for any regressions. A well defined load testing environment can be used to review experimental branches of possible performance improvements. It is also where you can determine the bottleneck and breaking point as you increase load 2X, 5X, 10X. It is impossible to be proactive when your system can fail at 2X load, and the engineering resources needed to implement a solution will not happen in time.

Disaster is inevitable. It will happen, whether small or large. Hardware and software inherently fails. How it fails and what is done to mitigate this to ensure the best possible consistent and rewarding consumer experience is only possible by consistently practicing to break your software at all stages in the development and deployment lifecycle.
AWS cost saving tips – EBS Volumes

A trivial cost saving tip for checking if you are spending money in your AWS environment on unused resources. This is especially appropriate when using provisioned IOPS EBS volumes.

$ ec2-describe-volumes | grep available

VOLUME	vol-44dff904	8	snap-d86d0884	us-east-1b	available	2014-08-01T14:11:24+0000	standard
VOLUME	vol-62dff922	100		us-east-1b	available	2014-08-01T14:11:24+0000	io1	1000
VOLUME	vol-15dff955	8	snap-d86d0884	us-east-1b	available	2014-08-01T14:11:24+0000	standard
VOLUME	vol-80a88ec0	8	snap-d86d0884	us-east-1b	available	2014-08-01T15:12:54+0000	standard
VOLUME	vol-ca82a48a	100		us-east-1b	available	2014-08-01T16:13:49+0000	standard
VOLUME	vol-5d79581d	8	snap-d86d0884	us-east-1b	available	2014-08-01T18:27:01+0000	standard
VOLUME	vol-baf9dbfa	8	snap-d86d0884	us-east-1b	available	2014-08-03T18:20:59+0000	standard
VOLUME	vol-53ffdd13	8	snap-d86d0884	us-east-1b	available	2014-08-03T18:25:52+0000	standard
VOLUME	vol-ade7daed	8	snap-d86d0884	us-east-1b	available	2014-08-13T20:10:46+0000	standard
VOLUME	vol-34e2df74	8	snap-065a2e52	us-east-1b	available	2014-08-13T20:26:17+0000	standard
VOLUME	vol-cacef38a	100	snap-280ffb7f	us-east-1b	available	2014-08-13T21:19:18+0000	standard
VOLUME	vol-41350a01	8	snap-f23ccba5	us-east-1b	available	2014-08-14T16:54:27+0000	standard
VOLUME	vol-51350a11	100	snap-fc3ccbab	us-east-1b	available	2014-08-14T16:54:27+0000	standard
VOLUME	vol-912f10d1	8	snap-96ee24c1	us-east-1b	available	2014-08-14T17:15:06+0000	standard
VOLUME	vol-a82f10e8	100	snap-9dee24ca	us-east-1b	available	2014-08-14T17:15:06+0000	standard

These are available and unused EBS volumes which you should consider deleting.

MySQL Admin 101 for System Admins – key_buffer_size

As discussed in my presentation to NYLUG, I wanted to provide system administrations with some really quick analysis and performance fixes if you had limited knowledge of MySQL.

One of the most important things with MySQL is to tune memory properly. This can be complex as there are global buffers, and per session buffers, memory tables, and differences between storage engines. Even this first tip has conditions.

Configuration of MySQL can be found in the my.cnf file (How can I find that). Some variables are dynamic and some are not, and these can change between versions. Check out The most important MySQL Reference Manual page that everybody should bookmark for reference.

Here is a great example for the key_buffer_size found in the [mysqld] section of my.cnf. This is also historically known in legacy config files as key_buffer. This older format has been removed in 5.7. This is a global buffer that is responsible for caching the MyISAM Index data only. Two important things here, this is for the MyISAM storage engine only, and it’s only for indexes. MyISAM data relies on the OS file system cache.

We can confirm the current value in a running MySQL instance with:

mysql> SELECT LOWER(variable_name) as variable, variable_value/1024/1024 as MB 
       FROM   information_schema.global_variables 
       WHERE  variable_name = 'key_buffer_size';
+-----------------+------+
| variable        | MB   |
+-----------------+------+
| key_buffer_size |   16 |
+-----------------+------+
1 row in set (0.00 sec)

The following query will give you the current size of MyISAM indexes stored on disk in your instance.


mysql> SELECT FORMAT(SUM(data_length)/1024/1024,2) as data_mb, 
              FORMAT(SUM(index_length)/1024/1024,2) as index_mb 
       FROM   information_schema.tables 
       WHERE  engine='MyISAM';
+--------------+--------------+
| data_mb      | index_mb     |
+--------------+--------------+
| 504.01       | 114.48       |
+--------------+--------------+
1 row in set (2.36 sec)

NOTE: This is all MyISAM indexes in all schemas. At this time we have not determined what is “hot” data, “cold” data, backup tables etc. It’s a crude calculation, but in absence of more information, seeing that MyISAM is being used, and the buffer is not configured (default is generally 8MB), or is configured poorly as in this example shows that changing this value is an important step to consider. However, The first part of solving the problem is identifying the problem.

Tuning the buffer is hard. You have to take into consideration the amount of system RAM, is the server dedicated for MySQL only, or a shared server for example with a web container such as Apache. Are other storage engines used (for example InnoDB) that requires it’s own buffer size, are there multiple MySQL Instances on the server.

For this example of tuning, we are assuming a dedicated MySQL server and no other storage engines used.

Determining the system RAM and current usage can be found with:

$ free -m
             total       used       free     shared    buffers     cached
Mem:          3955       3846        109          0        424       1891
-/+ buffers/cache:       1529       2426
Swap:         1027          0       1027

With this information, we see a system with 4G of RAM (plenty of available RAM), a key_buffer_size of 16M, and the current maximum size of indexes is 114M. For this most simple case it’s obvious we can increase this buffer, to say 128M and not affect overall system RAM usage, but improve MyISAM performance.

Here are the same numbers for a different system to give you a comparison of what you may uncover.

mysql> SELECT LOWER(variable_name) as variable, variable_value/1024/1024 as MB
    ->        FROM   information_schema.global_variables
    ->        WHERE  variable_name = 'key_buffer_size';
+-----------------+------+
| variable        | MB   |
+-----------------+------+
| key_buffer_size |  354 |
+-----------------+------+
1 row in set (0.00 sec)

mysql> SELECT FORMAT(SUM(data_length)/1024/1024,2) as data_mb,
    ->               FORMAT(SUM(index_length)/1024/1024,2) as index_mb
    ->        FROM   information_schema.tables
    ->        WHERE  engine='MyISAM';
+------------+------------+
| data_mb    | index_mb   |
+------------+------------+
| 150,073.57 | 122,022.97 |
+------------+------------+
1 row in set (3.71 sec)

As I follow up in my next post on the innodb_buffer_pool_size, I will further clarify the complexity of MySQL memory tuning, and show that this information gathering is only a guide, and first step to a more complex analysis and tuning operation.

Improving performance – A full stack problem

Improving the performance of a web system involves knowledge of how the entire technology stack operates and interacts. There are many simple and common tips that can provide immediate improvements for a website. Some examples include:

  • Using a CDN for assets
  • Compressing content
  • Making fewer requests (web, cache, database)
  • Asynchronous management
  • Optimizing your SQL statements
  • Have more memory
  • Using SSD’s for database servers
  • Updating your software versions
  • Adding more servers
  • Configuring your software correctly
  • … And the general checklist goes on

Understanding where to invest your energy first, knowing what the return on investment can be, and most importantly the measurement and verification of every change made is the difference between blind trial and error and a solid plan and process. Here is a great example for the varied range of outcome to the point about “Updating your software versions”.

On one project the MySQL database was reaching saturation, both the maximum number of database connections and maximum number of concurrent InnoDB transactions. The first is a configurable limit, the second was a hard limit of the very old version of the software. Changing the first configurable limit can have dire consequences, there is a tipping point, however that is a different discussion. A simple software upgrade of MySQL which had many possible improvement benefits, combined with corrected configuration specific for this new version made an immediate improvement. The result moved a production system from crashing consistently under load, to at least barely surviving under load. This is an important first step in improving the customer experience.

In the PHP application stack for the same project the upgrading of several commonly used frameworks including Slim and Twig by the engineering department seemed like a good idea. However applicable load testing and profiling (after it was deployed, yet another discussion point) found the impact was a 30-40% increase in response time for the application layer. This made the system worse, and cancelled out prior work to improve the system.

How to tune a system to support 100x load increase with no impact in performance takes knowledge, experience, planning, testing and verification.

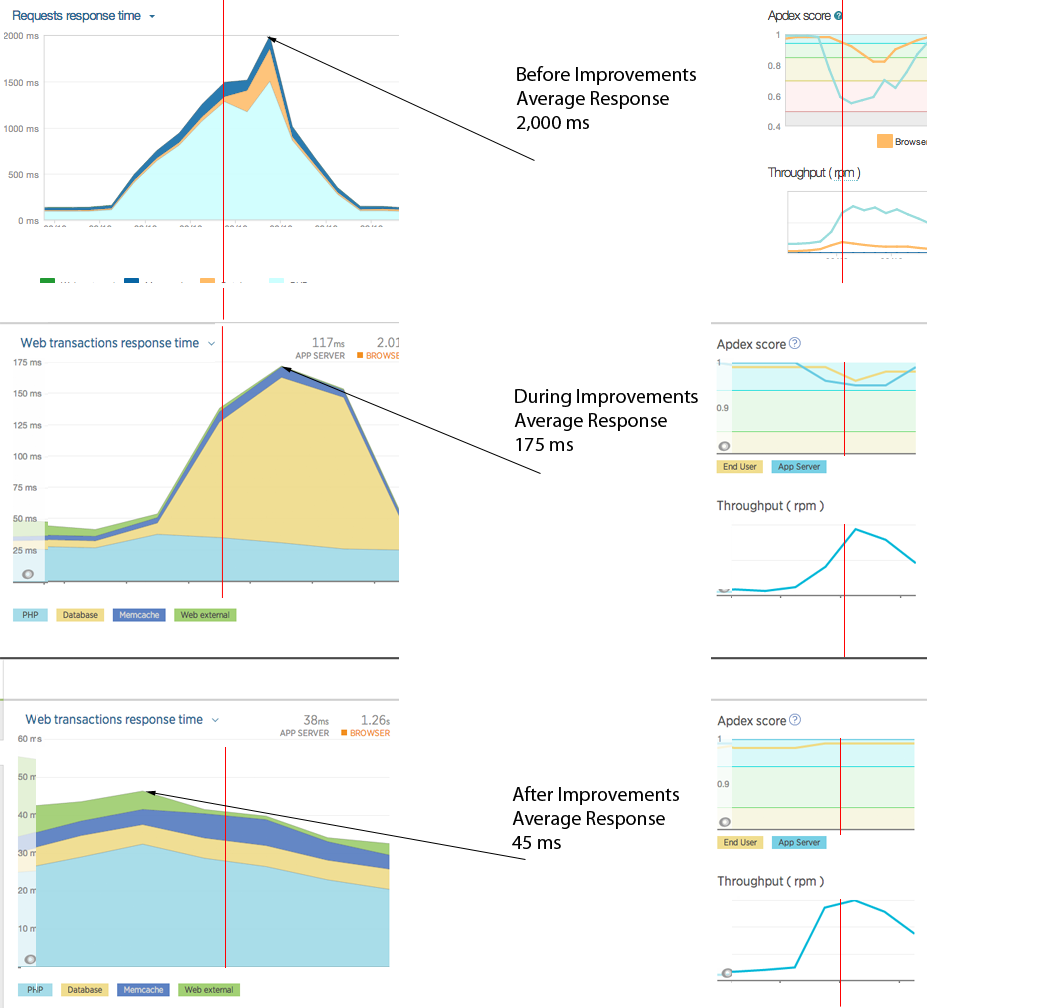
The following summarized graphs; using New Relic monitoring as a means of representative comparison; shows three snapshots of the average response time during various stages of full stack tuning and optimization. This is a very simplified graphical view that is supported by more detailed instrumentation using different products, specifically with much finer granularity of hundreds of metrics.

These graphs represent the work undertaken for a system under peak load showing an average 2,000ms response time, to the same workload under 50ms average response time. That is a 40x improvement!

If your organization can benefit from these types of improvements feel free to Contact Me.

There are numerous steps to achieving this. A few highlights to show the scope of work you need to consider includes:

  • Knowing server CPU saturation verses single core CPU saturation.
  • Network latency detection and mitigation.
  • What are the virtualization mode options of virtual cloud instances?
  • Knowing the network stack benefits of different host operating systems.
  • Simulating production load is much harder than it sounds.
  • Profiling, Profiling, Profiling.
  • Instrumentation can be misleading. Knowing how different monitoring works with sampling and averaging.
  • Tuning the stack is an iterative process.
  • The simple greatest knowledge is to know your code, your libraries, your dependencies and how to optimize each specific area of your technology stack.
  • Not everything works, some expected wins provided no overall or observed benefits.
  • There is always more that can be done. Knowing when to pause and prioritize process optimizations over system optimizations.

These graphs show the improvement work in the application tier (1500ms to 35ms to 25ms) and the database tier (500ms to 125ms to 10ms) at various stages. These graphs do not show for example improvements made in DNS resolution, different CDNs, managing static content, different types and ways of compression, remove unwanted software components and configuration, standardized and consistent stack deployments using chef, and even a reduction in overall servers. All of these successes contributed to a better and more consistent user experience.

40x performance improvements in LAMP stack

Writing re-runable shell script

I recently started playing with devstack again (An all-in-on OpenStack developer setup). Last time was over 3 years ago because I remember a pull request for a missing dependency at the time.

The installation docs provide information to bootstrap your system with a necessary user and privileges, however like many docs for software setup they contain one off instructions.

adduser stack
echo "stack ALL=(ALL) NOPASSWD: ALL" >> /etc/sudoers

When you write operations code you need to always be thinking about “testability” and “automation”. It is important to write re-runable code. You should always write parameterized code when possible, which can be refactored into usable functions at any time.

This is a good example to demonstrate a simple test condition for making the initial instructions re-runable.

sudo su -
NEW_USER="stack"
# This creates default group of same username
# This creates user with default HOME in /home/stack
[ `grep ${NEW_USER} /etc/passwd | wc -l` -eq 0 ] && useradd -s /bin/bash -m ${NEW_USER}
NEW_USER_SUDO_FILE="/etc/sudoers.d/${NEW_USER}"
[ ! -s ${NEW_USER_SUDO_FILE} ] && umask 226 && echo "${NEW_USER} ALL=(ALL) NOPASSWD: ALL" > ${NEW_USER_SUDO_FILE}
ls -l ${NEW_USER_SUDO_FILE}

Correctly setting your mysql prompt using sudo

If you run multiple MySQL environments on multiple servers it’s a good habit to set your MySQL prompt to double check which server you are on.
however, using the MYSQL_PS1 environment variable I found this does not work under sudo (the normal way people run sudo).

I.e., the following syntax’s work.

$ mysql
$ sudo su - -c mysql
$ sudo su - ; mysql

but the following does not.

$ sudo mysql

The trick is actually to ensure via /etc/sudoers you inherit the MySQL_PS1 environment variable.

echo "export MYSQL_PS1="`hostname` [d]> "" | sudo tee /etc/profile.d/mysql.sh
echo 'Defaults    env_keep += "MYSQL_PS1"' | sudo tee /tmp/mysql
sudo chmod 400 /tmp/mysql
sudo mv /tmp/mysql /etc/sudoers.d

What is FTS_BEING_DELETED.ibd

I currently have on a MySQL 5.6 database using innodb_file_per_table the following individual tablespace file.

schema/FTS_00000000000001bb_BEING_DELETED.ibd

The schema is all InnoDB tables, and there ARE NO Full Text Indexes. I cannot comment on if a developer has tried to create one previously.
I am none the wiser in explaining the ongoing use of these files, or if it can be/should be deleted.

On closer inspection there are infact a number of FTS files.

$ ls -al FTS*
-rw-r----- 1 mysql mysql 98304 Jan 29 16:21 FTS_00000000000001bb_BEING_DELETED_CACHE.ibd
-rw-r----- 1 mysql mysql 98304 Jan 29 16:20 FTS_00000000000001bb_BEING_DELETED.ibd
-rw-r----- 1 mysql mysql 98304 Jan 29 16:26 FTS_00000000000001bb_CONFIG.ibd
-rw-r----- 1 mysql mysql 98304 Jan 29 16:21 FTS_00000000000001bb_DELETED_CACHE.ibd
-rw-r----- 1 mysql mysql 98304 Jan 29 16:00 FTS_00000000000001bb_DELETED.ibd
-rw-r----- 1 mysql mysql 98304 Jan 29 16:20 FTS_00000000000001c7_BEING_DELETED_CACHE.ibd
-rw-r----- 1 mysql mysql 98304 Jan 29 16:26 FTS_00000000000001c7_BEING_DELETED.ibd
-rw-r----- 1 mysql mysql 98304 Jan 29 16:21 FTS_00000000000001c7_CONFIG.ibd
-rw-r----- 1 mysql mysql 98304 Jan 29 16:20 FTS_00000000000001c7_DELETED_CACHE.ibd
-rw-r----- 1 mysql mysql 98304 Jan 29 16:20 FTS_00000000000001c7_DELETED.ibd

Any MySQL gurus with knowledge to share, and for the benefit of others that Internet search at a later time.

Related articles included Overview and Getting Started with InnoDB FTS and Difference between InnoDB FTS and MyISAM FTS but do not mention file specifics.

The article InnoDB Full-text Search in MySQL 5.6 (part 1) provides more insight that these files remain even if a full text index was created and has since being removed. It is not clear from the filename which tables these files relate to.

Good Test Data

Over the years you collect datasets you have created for various types of testing, seeding databases etc. I have always thought one needs to better manage this for future re-use. Recently I wanted to do some “Big Data” playing and again that question of what datasets can I use let me to review the past collated list at Seeking public data for benchmarks.

The types of things I was wanting to do lead me to realize a lot of content is “public domain” and Project Gutenberg is just one great source of text in multiple languages. This was just one aspect of my wish list but text based data is used from blogs, comments, articles, microblogs etc, and multiple languages was important from some text analysis.

With a bit of thinking about the building blocks, I created Good Test Data. A way for me to have core data, IP’s, people’s names, User Agents strings, text for articles, comments and a lot more. And importantly the ability to generate large randomized amounts of this data quickly and easily.

Now I can build a list of 1 million random names with unique usernames and emails with ease. I can generate millions of varying articles, from a short microblog, a comment, a blog to a multi page article. Then be able to produce HTML/PDF/PNG versions giving me file attachments. I’ve been playing more with image generation, creating banner images with varying text, and now I’m generating MP4 video to simulate the various standard sizes for advertising and just to see what people need.

I’m not sure of the potential use and benefit for others and that wasn’t the primary goal, however I would like to know how these building blocks could be used. The data is relatively agnostic, being able to easily load into MySQL tables. Depending on demand, being able to create pre-configured open source product data for e-commence products, CRM or blogging are all possible options.

The GRANT/REVOKE dilemma

It is common practice to grant your application the privileges of “GRANT SELECT, INSERT, UPDATE, DELETE ON yourdb.* TO user@host”.

But what if you want to ensure you cannot DELETE data from just one table?

Ideally I want to be able to “REVOKE DELETE ON yourdb.important_table FROM user@host”. You cannot do currently this with the MySQL privilege system.

If your schema has 100 tables, and you want to remove DELETE from one, you have to define DELETE for the 99 others, and remember that for each new table, you need to remember to also modify user privileges.

Simple steps to increasing site availability

A recent database production migration with a large client highlighted a fundamental flaw in their designed architecture for suitable site availability. While the development team had take several good steps in improving scalability of the site, there was a clear failure in understanding and supporting different levels of data availability which I cover in my presentation Successful Scalability Principles.

It was the decision of the development manager to shut down the entire site to perform a final DB migration. The downtime was only 60 seconds but this approach was completely unnecessary with any user requests simply being rejected without any explanation.

The Problem

The system had already be siloed/partitioned/sharded into 5 distinct sources of information. 4 of these data sources in MySQL had applicable read and write capacity (i.e. MySQL replication), and application configuration to support reading data not from the primary data source. Both of these principles are good steps towards scalability and performance. What was lacking was availability.

The wrong way

The migration of the final partition involved moving from AWS RDS to AWS EC2 instances running MySQL. This final all important module managed advertisements, campaigns and ad tracking required that no data was lost.

In AWS, the approach taken was to remove approximately 60 webservers from the public load balancer (ELB). The result of this was all requests, some 20,000 to 25,000 requests simply hung or produced a likely HTTP 500 error.

This was the first fundamental flaw. What does your website look like when it is unavailable? In this case this was never considered or planned for. At worse, all sites should have an emergency “site unavailable due to maintenance” page, trivially managed by a second virtual host in your apache web server configuration. This can be enabled with zero downtime. While inconveniencing the end user, you are informing the end user and they will be more receiving of proactive information.

The second fundamental flaw is that the unavailability of one part of the system, should not affect the entire system if there is no interaction. There are 5 distinct and standalone partitions, only 1 required downtime.

The Right Way

In this situation there was more then one approach to minimize downtime while switching data sources and to ensure all data was captured.

Most sites fail with the fundamental principle of supporting different levels of data availability. In this specific case, one partition (i.e. 1/5 of the data) would be unavailable. Why should that situation effect 100% of your website? Furthermore, only the ability to write was affected, why then should that affect the ability to read ads.

There are at least four types of data availability. Specifically the ability to write data, read data, read cached data and no data access. There are also more fine grained methods of which I will also discuss one.

Defining your data availability requires your application to support and manage data access. This is not easy if you application was not developed with this in mind. I will give you a simple example. Many popular LAMP frameworks including Drupal & WordPress were never designed for read scalability. They relied on a single MySQL server. The act of scaling reads, and providing a read-only site is an after thought and many website struggle to create creative ways to support this primary architectural design pattern.

Knowing that a user request requires the ability to read and/or write data is the first key step. Knowing what type of data is the second. Providing a messaging system between what levels of data access there is, and the ability to turn off features while maintaining site uptime is critical for improving site availability.

More advanced approaches then consider the role of caching data. Generally sites will use caching to assist in reads, but caching can also be implemented to support non critical writes. In this particular example, a write to cache presented a small but tangible risk for data loss. The solution was to implement a secondary logging strategy. This is a separate persistent write capability during the downtime, and the ability to replay. By limiting the writes to log only (i.e. write once) operations, it became very simple to migrate from one system to a second system, logging and reapplying all data changes and ensuring no site downtime, and no data loss.

Conclusion

Managing site availability comes back to a very important question. Clearly define your uptime needs.

Performance v Scalability – For Employers

In a recent discussion with a fellow peer reviewing a job description he was applying for, we got into a discussion on the specifics of a Performance Engineer verses a Scalability Engineer.

Performance and Scalability are two very different goals. While it is true that improving performance can lead to increased scalability capacity with the same physical resources, increasing the scalability of your application does not necessarily lead to improved performance.

Performance is all about perception. In layman’s terms, how quickly can you provide a response to a request from your customer. As volume increases, performance generally degrades after a certain point, and then as volume continues, often the outcome is complete failure. Having a suitable scalable architecture can enable you to provide consistent performance for a given and growing workload.

A Scalability Engineer needs to have architectural skills, management skills, deployment skills and automation skills. A Performance Engineer needs to have more specific technology skills, development skills and some architectural skills.

A great example of a performance problem is when a client contacts me to help with a slow performing website. When the home page takes 5 seconds to load, but only 500ms of that is the actual page generation, and ultimately the maximum possible amount of time spent in the database, in isolation as a database expert I could only improve on 10% of the actual problem. As a performance engineer, your knowledge of the full stack including the web container, the data store accesses (persistent and non-persistent), optimizing the network payload size with compression, various techniques of caching and parallelism capacities are all essential skills needed.

A scalability problem is when your site supports 5,000 concurrent users, but it needs to support 25,000. Applying the primary skills just listed will not solve your scalability need. Simply adding 5x of servers is a simple way to provide support for more concurrent users, but where is the bottleneck or limitation of your application as you scale. Does adding 5x web servers place too much load on your caching tier or your database tier? While most applications utilize load balancing for web traffic, and so a new webserver is generally straightforward (to a point), can your application even support adding more database servers? Or does your architecture lead to read scalability, but not write scalability? Not being able to scale writes is a clear single point of failure for scalability. Most scalability needs require (re)architecture of your stack and the management of how this can be achieved while maintaining an operational site. After a point when you have 500+ servers, adding 50 more servers is generally the role of great automated deployment processes. The problem is usually greater when moving from 5 servers to 25 servers.

For employers that are writing a job description and using a specific job title, consider if the objectives in the description matches the title.

This leads to the question, what about a Reliability Engineer? That is another detailed discussion that relates to performance and scalability, but also have very different goals. Clearly defining your uptime needs is just one question a reliability engineer needs to ask.

Clearly define your uptime needs

In writing about Performance and Scalability I referenced a quote that I have provided in a number of presentations regarding a valuable interaction with a client. All software architects and managers need to clearly understand this for their own sites in order to enable technical resources to deliver a highly scalable solution.

Development Manager:  We need a maintenance window for software upgrades and new releases.
CTO:  No Downtime.
Development Manager: But we need this to fix problems and improve performance.
CTO:  No Downtime.
Consultant (aka Ronald Bradford):  Mr CTO. What is your definition of no downtime?
CTO:  We serve pages, we serve ads.
Consultant: We can do that.

Asking the right question about the uptime requirements completely changed the architecture needed to meeting these specific high availability needs.

It is important to know with this major TV network client the answer was not updating content, selling merchandise or enabling customers to comment. Each of these needs requires a different approach to high availability.

Unexplained halts using mysql command line client

I recently came across an issue trying to connect to a MySQL server using the mysql client. It appeared as through the connection was hanging.

A subsequent connection using the -A option highlighted the problem with the previous connection stuck in the state “Waiting for table metadata lock”.

mysql> SHOW PROCESSLISTG
*************************** 1. row ***************************
     Id: 37
   User: root
   Host: localhost
     db: tmp
Command: Query
   Time: 90
  State: preparing
   Info: create table missing as select id from AK where id not in (select id ..
*************************** 2. row ***************************
     Id: 38
   User: root
   Host: localhost
     db: tmp
Command: Field List
   Time: 50
  State: Waiting for table metadata lock
   Info:
*************************** 3. row ***************************
     Id: 39
   User: root
   Host: localhost
     db: tmp
Command: Query
   Time: 0
  State: init
   Info: show processlist

In this example you can see a long running CREATE TABLE … SELECT statement as the cause of the problem. The -A or –no-auto-rehash argument is a means of disabling the tab completion in the mysql command line client.

Giving thanks to MySQL authors challenge

Next week the US celebrates Thanksgiving Day. For those that are American or live here, this is a significant event. Three different experiences recently have lead me to write this request for ALL MySQL community members to give thanks to those that have contributed to the MySQL ecosystem. I have made a commitment to myself, and I would like to challenge others to write one book review per week in December, that’s 4 book reviews to the MySQL books that I have on my bookshelf that have made an impact in some way. I ask others to give it a go too.

It only takes a few minutes to pen a comment on Amazon, or a publishers site, but to authors it means so much more. I can only speak for myself, but any comment; good, bad or ugly; helps to know you are out there and you took the time to acknowledge somebody’s work of art (in this case a publication).

I only have to look at my bookshelf and I find the following MySQL books (in order they currently are placed which is no specific order), MySQL Crash Course by Ben Forta, MySQL Clustering by Alex Davies and Harrison Fisk, MySQL Cookbook by Paul DuBois, MySQL Stored Procedure Programming by Guy Harrison, Developing Web Applications with Apache, MySQL, memcached, and Perl by Patrick Galbraith, Pro MySQL (The Expert’s Voice in Open Source) by Mike Kruckenberg and Jay Pipes, MySQL Administrator’s Bible by Sheeri Cabral, MySQL (Third Edition) by Paul DuBois, High Performance MySQL: Optimization, Backups, Replication, and More (Second Edition) by Baron Schwartz, Peter Zaitsev, Vadim Tkachenko, Jeremy Zawodny, Arjen Lentz and Derek Balling, High Performance MySQL: Optimization, Backups, and Replication (Third Edition) by Baron Schwartz, Peter Zaitsev, Vadim Tkachenkoo, MySQL High Availability: Tools for Building Robust Data Centers by Charles Bell, Mats Kindal and Lars Thalman, Expert PHP and MySQLby Andrew Curiso, Ronald Bradford and Patrick Galbraith, Effective MySQL Backup and Recovery (Oracle Press) by Ronald Bradford, Effective MySQL Replication Techniques in Depth by Ronald Bradford and Chris Schneider, Effective MySQL Optimizing SQL Statements (Oracle Press) by Ronald Bradford, Database in Depth: Relational Theory for Practitioners by Chris Date, Pentaho Solutions: Business Intelligence and Data Warehousing with Pentaho and MySQL by Roland Bouman and Josh an Dongen, MySQL Administrator’s Guide and Language Reference (2nd Edition) and MySQL 5.0 Certification Study Guide by Paul Dubois, Stefan Hinz and Cartsten Pedersen.

And they are just the physical books, I have several PDF and Kindle only versions, and other MySQL Books I know about and have not purchased.

I would also like to give a special shout out to Sheeri Cabral and MySQL Marinate. A program using the O’Reilly Learning MySQL book to help anybody that wants to learn. At my most recent Effective MySQL Meetup a beginner question was asked by an audience member, and it was another audience member (not even myself) that piped up and recommended MySQL Marinate.

Finally, I learned MySQL by reading the online reference manual from cover to cover, and I did it again several years later, and probably should do it again some day. I am unable to find the names of the authors present or past, nor the right place you could leave a comment, but thanks to those I do know about, Jon Stephens, Mike Hillyer, Stefan Hinz, MC Brown and Paul DuBois.

Kick all the tires before you buy the product

Translating theory to practice is never easy. Morgan gives us the right steps in a play environment to move from dev.mysql.com native MySQL rpm’s to the new MySQL yum repository. I thought I would try it out.

1. Confirming existing packages

A necessary step, however immediately I have more dependencies including Perl DBD (used in several utilities) including MHA.

$ sudo su -
$ rpm -qa | grep -i mysql
MySQL-devel-5.6.13-1.el6.x86_64
MySQL-test-5.6.13-1.el6.x86_64
MySQL-shared-compat-5.6.13-1.el6.x86_64
MySQL-server-5.6.13-1.el6.x86_64
perl-DBD-MySQL-4.013-3.el6.x86_64
MySQL-client-5.6.13-1.el6.x86_64
MySQL-embedded-5.6.13-1.el6.x86_64
MySQL-shared-5.6.13-1.el6.x86_64
mha4mysql-node-0.54-1.el5.noarch

A further trap in the more complex real-world environments, in my case the installation of Percona XtraBackup. This will become apparent in the next step. We need to check for these packages.

$ rpm -qa | grep -i percona
percona-release-0.0-1.x86_64
percona-xtrabackup-2.1.4-656.rhel6.x86_64

1. Update your environment

There is a mixed blessing here. Assuming you keep your machines current (and you should), the impact here should be minimal, but buyer beware. In my case the update wanted to update java-1.7.0-openjdk. Should not be a big deal, but what other products are impacted by updates? Java on this system for example is used by the New Relic MySQL Monitoring. What if there was some important application component that may become unravelled with some update.

Doing a blanket update on a reasonably current CentOS 6.4 system broke.

$ yum update
...
Installing:
 Percona-SQL-shared-compat                      x86_64                5.0.92-b23.89.rhel6                      percona                1.1 M
     replacing  MySQL-shared.x86_64 5.6.13-1.el6
 Percona-Server-shared-compat                   x86_64                5.5.34-rel32.0.591.rhel6                 percona                3.4 M
     replacing  MySQL-shared.x86_64 5.6.13-1.el6
 Percona-Server-shared-compat-51                x86_64                5.1.72-rel14.10.597.rhel6                percona                2.4 M
     replacing  MySQL-shared.x86_64 5.6.13-1.el6
 kernel                                         x86_64                2.6.32-358.23.2.el6                      updates                 26 M
Transaction Summary
============================================================================================================================================
Install       4 Package(s)
Upgrade      26 Package(s)

...
Transaction Check Error:
  file /usr/lib64/libmysqlclient.so.12.0.0 from install of Percona-SQL-shared-compat-5.0.92-b23.89.rhel6.x86_64 conflicts with file from package MySQL-shared-compat-5.6.13-1.el6.x86_64
  file /usr/lib64/libmysqlclient.so.14.0.0 from install of Percona-SQL-shared-compat-5.0.92-b23.89.rhel6.x86_64 conflicts with file from package MySQL-shared-compat-5.6.13-1.el6.x86_64
  file /usr/lib64/libmysqlclient_r.so.12.0.0 from install of Percona-SQL-shared-compat-5.0.92-b23.89.rhel6.x86_64 conflicts with file from package MySQL-shared-compat-5.6.13-1.el6.x86_64
  file /usr/lib64/libmysqlclient_r.so.14.0.0 from install of Percona-SQL-shared-compat-5.0.92-b23.89.rhel6.x86_64 conflicts with file from package MySQL-shared-compat-5.6.13-1.el6.x86_64
  file /usr/lib64/libmysqlclient.so.16.0.0 from install of Percona-Server-shared-compat-5.5.34-rel32.0.591.rhel6.x86_64 conflicts with file from package MySQL-shared-compat-5.6.13-1.el6.x86_64
  file /usr/lib64/libmysqlclient_r.so.16.0.0 from install of Percona-Server-shared-compat-5.5.34-rel32.0.591.rhel6.x86_64 conflicts with file from package MySQL-shared-compat-5.6.13-1.el6.x86_64
  file /usr/lib64/libmysqlclient.so.12.0.0 conflicts between attempted installs of Percona-Server-shared-compat-5.5.34-rel32.0.591.rhel6.x86_64 and Percona-SQL-shared-compat-5.0.92-b23.89.rhel6.x86_64
  file /usr/lib64/libmysqlclient.so.14.0.0 conflicts between attempted installs of Percona-Server-shared-compat-5.5.34-rel32.0.591.rhel6.x86_64 and Percona-SQL-shared-compat-5.0.92-b23.89.rhel6.x86_64
  file /usr/lib64/libmysqlclient_r.so.12.0.0 conflicts between attempted installs of Percona-Server-shared-compat-5.5.34-rel32.0.591.rhel6.x86_64 and Percona-SQL-shared-compat-5.0.92-b23.89.rhel6.x86_64
  file /usr/lib64/libmysqlclient_r.so.14.0.0 conflicts between attempted installs of Percona-Server-shared-compat-5.5.34-rel32.0.591.rhel6.x86_64 and Percona-SQL-shared-compat-5.0.92-b23.89.rhel6.x86_64
...

The problem here is an unhealthy relationship between repositories for Percona Xtrabackup. I don’t know the reason, but this is the curse of dependencies that make real world upgrades more complex.

Updating just MySQL is rather useless as it’s installed by rpm.

$ yum update MySQL-server
Loaded plugins: fastestmirror, presto
Loading mirror speeds from cached hostfile
 * base: mirror.cogentco.com
 * extras: mirror.cogentco.com
 * updates: mirror.trouble-free.net
Setting up Update Process
No Packages marked for Update

Removing existing MySQL

Stopping MySQL is easy. Making a decision about, should I backup important files, like the config file, or the data should be considered here. The reality is for a production system, assume something unexpected will happen, even if you have tested it. Being able to go back in any step of an upgrade is actually more important than the step itself. So the following IS NOT ENOUGH in a production system.

service mysql stop

This old dinosaur learned a new trick in the yum interactive shell. Cool!

Note, I am doing a point release upgrade here, from .13 to .14.

$ yum shell
> remove MySQL-client-5.6.13-1.el6 MySQL-embedded-5.6.13-1.el6 MySQL-server-5.6.13-1.el6 MySQL-shared-5.6.13-1.el6 MySQL-devel-5.6.13-1.el6 MySQL-test-5.6.13-1.el6 MySQL-shared-compat-5.6.13-1.el6
> install mysql-community-server
> run

Now the fun begins, you have to read carefully what is happening, check out the Removing for dependencies section.

============================================================================================================================================
 Package                              Arch                 Version                            Repository                               Size
============================================================================================================================================
Installing:
 mysql-community-server               x86_64               5.6.14-3.el6                       mysql-community                          51 M
Removing:
 MySQL-client                         x86_64               5.6.13-1.el6                       installed                                81 M
 MySQL-devel                          x86_64               5.6.13-1.el6                       installed                                19 M
 MySQL-embedded                       x86_64               5.6.13-1.el6                       installed                               431 M
 MySQL-server                         x86_64               5.6.13-1.el6                       installed                               235 M
 MySQL-shared                         x86_64               5.6.13-1.el6                       installed                               8.4 M
 MySQL-shared-compat                  x86_64               5.6.13-1.el6                       installed                                11 M
 MySQL-test                           x86_64               5.6.13-1.el6                       installed                               318 M
Installing for dependencies:
 mysql-community-client               x86_64               5.6.14-3.el6                       mysql-community                          18 M
 mysql-community-common               x86_64               5.6.14-3.el6                       mysql-community                         296 k
 mysql-community-libs                 x86_64               5.6.14-3.el6                       mysql-community                         1.8 M
Removing for dependencies:
 cronie                               x86_64               1.4.4-7.el6                        @CentOS6-Base/$releasever               166 k
 cronie-anacron                       x86_64               1.4.4-7.el6                        @CentOS6-Base/$releasever                43 k
 crontabs                             noarch               1.10-33.el6                        @CentOS6-Base/$releasever               2.4 k
 mha4mysql-node                       noarch               0.54-1.el5                         installed                                98 k
 percona-xtrabackup                   x86_64               2.1.4-656.rhel6                    @percona                                 24 M
 perl-DBD-MySQL                       x86_64               4.013-3.el6                        @base                                   338 k
 postfix                              x86_64               2:2.6.6-2.2.el6_1                  @CentOS6-Base/$releasever               9.7 M
 sysstat                              x86_64               9.0.4-20.el6                       @base                                   807 k

Transaction Summary
============================================================================================================================================
Install       4 Package(s)
Remove       15 Package(s)

Also, you need to quit the yum shell.

> quit
Leaving Shell

Verification

So, we have now installed MySQL via the new yum repositories, and we can verify this.

$ service mysqld start
Starting mysqld:                                           [  OK  ]
$ mysql -e "SELECT VERSION()"
+------------+
| VERSION()  |
+------------+
| 5.6.14-log |
+------------+
$ chkconfig mysqld on

But, we now have a broken system, because dependencies were removed.

Extra steps needed

Installation of Percona Backup.

$ yum install percona-xtrabackup
Loaded plugins: fastestmirror, presto
Loading mirror speeds from cached hostfile
 * base: mirrors.advancedhosters.com
 * extras: mirror.cogentco.com
 * updates: mirror.trouble-free.net
Setting up Install Process
Resolving Dependencies
--> Running transaction check
---> Package percona-xtrabackup.x86_64 0:2.1.5-680.rhel6 will be installed
--> Processing Dependency: perl(DBD::mysql) for package: percona-xtrabackup-2.1.5-680.rhel6.x86_64
--> Running transaction check
---> Package perl-DBD-MySQL.x86_64 0:4.013-3.el6 will be installed
--> Processing Dependency: libmysqlclient.so.16(libmysqlclient_16)(64bit) for package: perl-DBD-MySQL-4.013-3.el6.x86_64
--> Processing Dependency: libmysqlclient.so.16()(64bit) for package: perl-DBD-MySQL-4.013-3.el6.x86_64
--> Running transaction check
---> Package Percona-Server-shared-51.x86_64 0:5.1.72-rel14.10.597.rhel6 will be installed
--> Finished Dependency Resolution

Dependencies Resolved

============================================================================================================================================
 Package                                  Arch                   Version                                      Repository               Size
============================================================================================================================================
Installing:
 percona-xtrabackup                       x86_64                 2.1.5-680.rhel6                              percona                 6.8 M
Installing for dependencies:
 Percona-Server-shared-51                 x86_64                 5.1.72-rel14.10.597.rhel6                    percona                 2.1 M
 perl-DBD-MySQL                           x86_64                 4.013-3.el6                                  base                    134 k

Transaction Summary
============================================================================================================================================
Install       3 Package(s)

Total size: 9.1 M
Total download size: 2.3 M
Installed size: 30 M
Is this ok [y/N]: y
Downloading Packages:
Setting up and reading Presto delta metadata
Processing delta metadata
Package(s) data still to download: 2.3 M
(1/2): Percona-Server-shared-51-5.1.72-rel14.10.597.rhel6.x86_64.rpm                                                 | 2.1 MB     00:00
(2/2): perl-DBD-MySQL-4.013-3.el6.x86_64.rpm                                                                         | 134 kB     00:00
--------------------------------------------------------------------------------------------------------------------------------------------
Total                                                                                                       9.7 MB/s | 2.3 MB     00:00
Running rpm_check_debug
Running Transaction Test
Transaction Test Succeeded
Running Transaction
  Installing : Percona-Server-shared-51-5.1.72-rel14.10.597.rhel6.x86_64                                                                1/3
  Installing : perl-DBD-MySQL-4.013-3.el6.x86_64                                                                                        2/3
  Installing : percona-xtrabackup-2.1.5-680.rhel6.x86_64                                                                                3/3
  Verifying  : percona-xtrabackup-2.1.5-680.rhel6.x86_64                                                                                1/3
  Verifying  : perl-DBD-MySQL-4.013-3.el6.x86_64                                                                                        2/3
  Verifying  : Percona-Server-shared-51-5.1.72-rel14.10.597.rhel6.x86_64                                                                3/3

Installed:
  percona-xtrabackup.x86_64 0:2.1.5-680.rhel6

Dependency Installed:
  Percona-Server-shared-51.x86_64 0:5.1.72-rel14.10.597.rhel6                      perl-DBD-MySQL.x86_64 0:4.013-3.el6

Complete!

Please explain this one to be batman, removing MySQL removed the sysstat package. Very weird.

$ iostat
-bash: iostat: command not found
$ yum install sysstat
Loaded plugins: fastestmirror, presto
Loading mirror speeds from cached hostfile
 * base: mirrors.advancedhosters.com
 * extras: mirror.cogentco.com
 * updates: centos.someimage.com
Setting up Install Process
Resolving Dependencies
--> Running transaction check
---> Package sysstat.x86_64 0:9.0.4-20.el6 will be installed
--> Processing Dependency: /etc/cron.d for package: sysstat-9.0.4-20.el6.x86_64
--> Running transaction check
---> Package cronie.x86_64 0:1.4.4-7.el6 will be installed
--> Processing Dependency: dailyjobs for package: cronie-1.4.4-7.el6.x86_64
--> Processing Dependency: /usr/sbin/sendmail for package: cronie-1.4.4-7.el6.x86_64
--> Running transaction check
---> Package cronie-anacron.x86_64 0:1.4.4-7.el6 will be installed
--> Processing Dependency: crontabs for package: cronie-anacron-1.4.4-7.el6.x86_64
---> Package postfix.x86_64 2:2.6.6-2.2.el6_1 will be installed
--> Running transaction check
---> Package crontabs.noarch 0:1.10-33.el6 will be installed
--> Finished Dependency Resolution

Dependencies Resolved

============================================================================================================================================
 Package                              Arch                         Version                                 Repository                  Size
============================================================================================================================================
Installing:
 sysstat                              x86_64                       9.0.4-20.el6                            base                       225 k
Installing for dependencies:
 cronie                               x86_64                       1.4.4-7.el6                             base                        70 k
 cronie-anacron                       x86_64                       1.4.4-7.el6                             base                        29 k
 crontabs                             noarch                       1.10-33.el6                             base                        10 k
 postfix                              x86_64                       2:2.6.6-2.2.el6_1                       base                       2.0 M

Transaction Summary
============================================================================================================================================
Install       5 Package(s)

Total download size: 2.4 M
Installed size: 11 M
Is this ok [y/N]: y
Downloading Packages:
Setting up and reading Presto delta metadata
Processing delta metadata
Package(s) data still to download: 2.4 M
(1/5): cronie-1.4.4-7.el6.x86_64.rpm                                                                                 |  70 kB     00:00
(2/5): cronie-anacron-1.4.4-7.el6.x86_64.rpm                                                                         |  29 kB     00:00
(3/5): crontabs-1.10-33.el6.noarch.rpm                                                                               |  10 kB     00:00
(4/5): postfix-2.6.6-2.2.el6_1.x86_64.rpm                                                                            | 2.0 MB     00:00
(5/5): sysstat-9.0.4-20.el6.x86_64.rpm                                                                               | 225 kB     00:00
--------------------------------------------------------------------------------------------------------------------------------------------
Total                                                                                                        21 MB/s | 2.4 MB     00:00
Running rpm_check_debug
Running Transaction Test
Transaction Test Succeeded
Running Transaction
  Installing : 2:postfix-2.6.6-2.2.el6_1.x86_64                                                                                         1/5
  Installing : cronie-1.4.4-7.el6.x86_64                                                                                                2/5
  Installing : crontabs-1.10-33.el6.noarch                                                                                              3/5
  Installing : cronie-anacron-1.4.4-7.el6.x86_64                                                                                        4/5
  Installing : sysstat-9.0.4-20.el6.x86_64                                                                                              5/5
  Verifying  : crontabs-1.10-33.el6.noarch                                                                                              1/5
  Verifying  : cronie-1.4.4-7.el6.x86_64                                                                                                2/5
  Verifying  : 2:postfix-2.6.6-2.2.el6_1.x86_64                                                                                         3/5
  Verifying  : sysstat-9.0.4-20.el6.x86_64                                                                                              4/5
  Verifying  : cronie-anacron-1.4.4-7.el6.x86_64                                                                                        5/5

Installed:
  sysstat.x86_64 0:9.0.4-20.el6

Dependency Installed:
  cronie.x86_64 0:1.4.4-7.el6    cronie-anacron.x86_64 0:1.4.4-7.el6    crontabs.noarch 0:1.10-33.el6    postfix.x86_64 2:2.6.6-2.2.el6_1

Complete!

Re-installing MySQL MHA node.

$ cd /tmp
$ wget http://mysql-master-ha.googlecode.com/files/mha4mysql-node-0.54-0.el6.noarch.rpm
$ sudo rpm -ivh mha4mysql-node-*.noarch.rpm

There is now a lot more work needed to check and recheck the dependencies and verify what did work previously still works.

At this time doing this on 20 DB servers to move to the new yum repository is a fail for this client. It’s simply not worth it.

Conclusion

Theory easy, practice not to easy!

What SQL is running in MySQL

Using the MySQL 5.6 Performance Schema it is very easy to see what is actually running on your MySQL instance. No more sampling or installing software or worrying about disk I/O performance with techniques like SHOW PROCESSLIST, enabling the general query log or sniffing the TCP/IP stack.

The following SQL is used to give me a quick 60 second view on a running MySQL system of ALL statements executed.

use performance_schema;
update setup_consumers set enabled='YES' where name IN ('events_statements_history','events_statements_current','statements_digest');
truncate table events_statements_current; truncate table events_statements_history; truncate table events_statements_summary_by_digest;
do sleep(60);
select now(),(count_star/(select sum(count_star) FROM events_statements_summary_by_digest) * 100) as pct, count_star, left(digest_text,150) as stmt, digest from events_statements_summary_by_digest order by 2 desc;
update setup_consumers set enabled='NO' where name IN ('events_statements_history','events_statements_current','statements_digest');

NOTE: These statements are for simple debugging and demonstration purposes. If you want to monitor SQL statements on an ongoing basis, you should not simply truncate tables and globally enable/disable options.

There are four performance schema tables that are applicable for looking at initial SQL analysis.

  1. The events_statements_summary_by_digest table shown below gives as the name suggests a way to summarize all queries into a common query pattern (or digest). This is great to get a picture of volume and frequency of SQL statements.
  2. The events_statements_current shows the currently running SQL statements
  3. The events_statements_history shows the fun, because it provides a *short, default 10 threads* history of the SQL statements that have run in any given thread.
  4. The events_statements_history_long (when enabled) gives you a history of the most recent 10,000 events.

One query can give me a detailed review of the type and frequency of ALL SQL statements run. The ALL is important, because on a slave you also get ALL replication applied events.

mysql> select now(),(count_star/(select sum(count_star) FROM events_statements_summary_by_digest) * 100) as pct, count_star, left(digest_text,150) as stmt, digest from events_statements_summary_by_digest order by 2 desc;
select * from events_statements_current where digest='ffb6231b78efc022175650d37a837b99'G
+---------------------+---------+------------+--------------------------------------------------------------------------------------------------------------------------------------------------------+----------------------------------+
| now()               | pct     | count_star | stmt                                                                                                                                                   | digest                           |
+---------------------+---------+------------+--------------------------------------------------------------------------------------------------------------------------------------------------------+----------------------------------+
| 2013-11-07 18:24:46 | 60.6585 |       7185 | SELECT * FROM `D.....` WHERE `name` = ?                                                                                                                | d6399273d75e2348d6d7ea872489a30c |
| 2013-11-07 18:24:46 | 23.4192 |       2774 | SELECT nc . id , nc . name FROM A.................. anc JOIN N........... nc ON anc . ............_id = nc . id WHERE ......._id = ?                   | c6e2249eb91767aa09945cbb118adbb3 |
| 2013-11-07 18:24:46 |  5.5298 |        655 | BEGIN                                                                                                                                                  | 7519b14a899fd514365211a895f5e833 |
| 2013-11-07 18:24:46 |  4.6180 |        547 | INSERT INTO V........ VALUES (...) ON DUPLICATE KEY UPDATE v.... = v.... + ?                                                                           | ffb6231b78efc022175650d37a837b99 |
| 2013-11-07 18:24:46 |  1.0891 |        129 | SELECT COUNT ( * ) FROM T............... WHERE rule = ? AND ? LIKE concat ( pattern , ? )                                                              | 22d984df583adc9a1ac282239e7629e2 |
| 2013-11-07 18:24:46 |  1.0553 |        125 | SELECT COUNT ( * ) FROM T............... WHERE rule = ? AND ? LIKE concat ( ? , pattern , ? )                                                          | a8ee43287bb2ee35e2c144c569a8b2de |
| 2013-11-07 18:24:46 |  0.9033 |        107 | INSERT IGNORE INTO `K......` ( `id` , `k......` ) VALUES (...)                                                                                         | 675e32e9eac555f33df240e80305c013 |
| 2013-11-07 18:24:46 |  0.7936 |         94 | SELECT * FROM `K......` WHERE k...... IN (...)                                                                                                         | 8aa7dc3b6f729aec61bd8d7dfa5978fa |
| 2013-11-07 18:24:46 |  0.4559 |         54 | SELECT COUNT ( * ) FROM D..... WHERE NAME = ? OR NAME = ?                                                                                              | 1975f53832b0c2506de482898cf1fd37 |
| 2013-11-07 18:24:46 |  0.3208 |         38 | SELECT h . * FROM H........ h LEFT JOIN H............ ht ON h . id = ht . ......_id WHERE ht . ........._id = ? ORDER BY h . level ASC                 | ca838db99e40fdeae920f7feae99d19f |
| 2013-11-07 18:24:46 |  0.2702 |         32 | SELECT h . * , ( POW ( ? * ( lat - - ? ) , ? ) + POW ( ? * ( ? - lon ) * COS ( lat / ? ) , ? ) ) AS distance FROM H........ h FORCE INDEX ( lat ) WHER | cd6e32fc0a20fab32662e2b0a282845c |
| 2013-11-07 18:24:46 |  0.1857 |         22 | SELECT h . * , ( POW ( ? * ( lat - ? ) , ? ) + POW ( ? * ( - ? - lon ) * COS ( lat / ? ) , ? ) ) AS distance FROM H........ h FORCE INDEX ( lat ) WHER | a7b43944f5811ef36c0ded7e79793536 |
| 2013-11-07 18:24:46 |  0.0760 |          9 | SELECT h . * , ( POW ( ? * ( lat - ? ) , ? ) + POW ( ? * ( ? - lon ) * COS ( lat / ? ) , ? ) ) AS distance FROM H........ h FORCE INDEX ( lat ) WHERE  | 4ccd8b28ae9e87a9c0b372a58ca22af7 |
| 2013-11-07 18:24:46 |  0.0169 |          2 | SELECT * FROM `K......` WHERE k...... IN (?)                                                                                                           | 44286e824d922d8e2ba6d993584844fb |
| 2013-11-07 18:24:46 |  0.0084 |          1 | SELECT h . * , ( POW ( ? * ( lat - - ? ) , ? ) + POW ( ? * ( - ? - lon ) * COS ( lat / ? ) , ? ) ) AS distance FROM H........ h FORCE INDEX ( lat ) WH | 299095227a67d99824af2ba012b81633 |
| 2013-11-07 18:24:46 |  0.0084 |          1 | SELECT * FROM `H........` WHERE `id` = ?                                                                                                               | 2924ea1d925a6e158397406403a63e3a |
| 2013-11-07 18:24:46 |  0.0084 |          1 | SHOW ENGINE INNODB STATUS                                                                                                                              | 0b04d3acd555401f1cbc479f920b1bac |
| 2013-11-07 18:24:46 |  0.0084 |          1 | DO `sleep` (?)                                                                                                                                         | 3d6e973c2657d0d136bbbdad05e68c7a |
| 2013-11-07 18:24:46 |  0.0084 |          1 | SHOW ENGINE INNODB MUTEX                                                                                                                               | a031f0e6068cb12c5b7508106687c2cb |
| 2013-11-07 18:24:46 |  0.0084 |          1 | SELECT NOW ( ) , ( `count_star` / ( SELECT SUM ( `count_star` ) FROM `events_statements_summary_by_digest` ) * ? ) AS `pct` , `count_star` , LEFT ( `d | 8a9e990cd85d6c42a2e537d04c8c5910 |
| 2013-11-07 18:24:46 |  0.0084 |          1 | SHOW SLAVE STATUS                                                                                                                                      | d2a0ffb1232f2704cef785f030306603 |
| 2013-11-07 18:24:46 |  0.0084 |          1 | TRUNCATE TABLE `events_statements_summary_by_digest`                                                                                                   | a7bef5367816ca771571e648ba963515 |
| 2013-11-07 18:24:46 |  0.0084 |          1 | UPDATE `setup_consumers` SET `enabled` = ? WHERE NAME IN (...)                                                                                         | 8205ea424267a604a3a4f68a76bc0bbb |
| 2013-11-07 18:24:46 |  0.0084 |          1 | SHOW GLOBAL STATUS                                                                                                                                     | ddf94d7d7b176021b8586a3cce1e85c9 |
+---------------------+---------+------------+--------------------------------------------------------------------------------------------------------------------------------------------------------+----------------------------------+

This immediately shows me a single simple application query that is executed 60% of the time. Further review of the data and usage pattern shows that should be cached. This is an immediate improvement on system scalability.

While you can look at the raw performance schema data, using ps_helper from Mark Leith makes live easier using the statement_analysis view because of normalizing timers into human readable formats (check out lock_latency).

mysql> select * from ps_helper.statement_analysis order by exec_count desc limit 10;
+-------------------------------------------------------------------+-----------+------------+-----------+------------+---------------+-------------+-------------+--------------+-----------+---------------+--------------+------------+-----------------+-------------+-------------------+----------------------------------+
| query                                                             | full_scan | exec_count | err_count | warn_count | total_latency | max_latency | avg_latency | lock_latency | rows_sent | rows_sent_avg | rows_scanned | tmp_tables | tmp_disk_tables | rows_sorted | sort_merge_passes | digest                           |
+-------------------------------------------------------------------+-----------+------------+-----------+------------+---------------+-------------+-------------+--------------+-----------+---------------+--------------+------------+-----------------+-------------+-------------------+----------------------------------+
| CREATE VIEW `io_by_thread_by_l ... SUM ( `sum_timer_wait` ) DESC  |           |     146117 |         0 |          0 | 00:01:47.36   | 765.11 ms   | 734.74 us   | 00:01:02.00  |         3 |             0 |            3 |          0 |               0 |           0 |                 0 | c877ec02dce17ea0aca2f256e5b9dc70 |
| SELECT nc . id , nc . name FRO ...  nc . id WHERE ......._id = ?  |           |      41394 |         0 |          0 | 16.85 s       | 718.37 ms   | 407.00 us   | 5.22 s       |    155639 |             4 |       312077 |          0 |               0 |           0 |                 0 | c6e2249eb91767aa09945cbb118adbb3 |
| BEGIN                                                             |           |      16281 |         0 |          0 | 223.24 ms     | 738.82 us   | 13.71 us    | 0 ps         |         0 |             0 |            0 |          0 |               0 |           0 |                 0 | 7519b14a899fd514365211a895f5e833 |
| INSERT INTO V........ VALUES ( ...  KEY UPDATE v.... = v.... + ?  |           |      12703 |         0 |          0 | 1.73 s        | 34.23 ms    | 136.54 us   | 696.50 ms    |         0 |             0 |            0 |          0 |               0 |           0 |                 0 | ffb6231b78efc022175650d37a837b99 |
| SELECT * FROM `D.....` WHERE `name` = ?                           |           |      10620 |         0 |          0 | 3.85 s        | 25.21 ms    | 362.52 us   | 705.16 ms    |         1 |             0 |            1 |          0 |               0 |           0 |                 0 | d6399273d75e2348d6d7ea872489a30c |
| SELECT COUNT ( * ) FROM T..... ... ? LIKE concat ( pattern , ? )  |           |       2830 |         0 |          0 | 1.22 s        | 2.14 ms     | 432.60 us   | 215.62 ms    |      2830 |             1 |       101880 |          0 |               0 |           0 |                 0 | 22d984df583adc9a1ac282239e7629e2 |
| SELECT COUNT ( * ) FROM T..... ... KE concat ( ? , pattern , ? )  |           |       2727 |         0 |          0 | 932.01 ms     | 30.95 ms    | 341.77 us   | 189.47 ms    |      2727 |             1 |        38178 |          0 |               0 |           0 |                 0 | a8ee43287bb2ee35e2c144c569a8b2de |
| INSERT IGNORE INTO `K......` ( `id` , `k......` ) VALUES (...)    |           |       2447 |         0 |          0 | 499.33 ms     | 9.65 ms     | 204.06 us   | 108.28 ms    |         0 |             0 |            0 |          0 |               0 |           0 |                 0 | 675e32e9eac555f33df240e80305c013 |
| SELECT * FROM `K......` WHERE k...... IN (...)                    |           |       2237 |         0 |          0 | 1.58 s        | 62.33 ms    | 704.19 us   | 345.61 ms    |     59212 |            26 |        59212 |          0 |               0 |           0 |                 0 | 8aa7dc3b6f729aec61bd8d7dfa5978fa |
| SELECT COUNT ( * ) FROM D..... WHERE NAME = ? OR NAME = ?         |           |       1285 |         0 |          0 | 797.72 ms     | 131.29 ms   | 620.79 us   | 340.45 ms    |      1285 |             1 |            8 |          0 |               0 |           0 |                 0 | 1975f53832b0c2506de482898cf1fd37 |
+-------------------------------------------------------------------+-----------+------------+-----------+------------+---------------+-------------+-------------+--------------+-----------+---------------+--------------+------------+-----------------+-------------+-------------------+----------------------------------+

Indeed, this simple query highlights a pile of additional information necessary for analysis like:

  1. What is that CREATE VIEW command that’s executed many more times?
  2. In this view, query 2 is executed some 3x more then query 4, yet in my 60 second sample it was 3x less. Has the profile of query load changed. What exactly is being sampled in this view?
  3. The lock_latency shows some incredibility large lock times, over 5 seconds for the top SELECT statement. Is this an outlier. Unfortunately the views give min/avg/max for the total_latency but no breakdown on lock_latency to see how much of a problem this actually is?

A quick note, the statement_analysis_raw view gives you the full SQL statement, so for example the first point listed the statement actually was.

select query from ps_helper.statement_analysis_raw order by exec_count desc limit 1;
CREATE VIEW `io_by_thread_by_latency` AS SELECT IF ( `processlist_id` IS NULL , `SUBSTRING_INDEX` ( NAME , ? , - ? ) , `CONCAT` ( `processlist_user` , ? , `processlist_host` ) ) SYSTEM_USER , SUM ( `count_star` ) `count_star` , `format_time` ( SUM ( `sum_timer_wait` ) ) `total_latency` , `format_time` ( MIN ( `min_timer_wait` ) ) `min_latency` , `format_time` ( AVG ( `avg_timer_wait` ) ) `avg_latency` , `format_time` ( MAX ( `max_timer_wait` ) ) `max_latency` , `thread_id` , `processlist_id` FROM `performance_schema` . `events_waits_summary_by_thread_by_event_name` LEFT JOIN `performance_schema` . `threads` USING ( `thread_id` ) WHERE `event_name` LIKE ? AND `sum_timer_wait` > ? GROUP BY `thread_id` ORDER BY SUM ( `sum_timer_wait` ) DESC

A testimony to Linux resilience

A client released a new version of their website onto 20 AWS m1.medium instances (current site at peak load runs approximately 60 m1.medium webservers).
It was clearly an unsuccessful release, but what was surprising was the system did not actually crash, it was effectively a meltdown, but servers were still operational with load averages > 100. I was impressed with the ability for Linux to still (just) function.

parallel-ssh -o StrictHostKeyChecking=no -o ConnectTimeout=5 -i -h   uptime
 18:01:00 up 18:44,  0 users,  load average: 104.26, 110.03, 113.12
 18:01:00 up 18:56,  1 user,  load average: 62.33, 87.75, 90.40
 18:01:03 up 18:44,  0 users,  load average: 105.28, 115.33, 115.61
 18:01:03 up 18:44,  0 users,  load average: 149.35, 155.74, 133.68
 18:01:03 up 18:51,  0 users,  load average: 124.63, 121.31, 115.91
 18:01:03 up 18:44,  0 users,  load average: 118.99, 109.92, 110.60
 18:01:04 up 18:44,  0 users,  load average: 121.73, 118.40, 113.50
 18:01:04 up 18:44,  0 users,  load average: 113.89, 120.56, 114.64
 18:01:05 up 18:44,  0 users,  load average: 119.30, 119.71, 115.65
 18:01:05 up 18:44,  0 users,  load average: 126.33, 120.33, 119.02
 18:01:05 up 18:44,  0 users,  load average: 117.47, 113.01, 112.84
 18:01:05 up 18:44,  0 users,  load average: 172.21, 158.62, 135.19
 18:01:05 up 18:44,  0 users,  load average: 115.81, 114.96, 116.18
 18:01:05 up 18:44,  0 users,  load average: 122.25, 115.32, 115.27
 18:01:05 up 18:44,  0 users,  load average: 164.13, 168.04, 153.03
 18:01:05 up 18:44,  0 users,  load average: 123.80, 114.94, 110.29
 18:01:06 up 18:44,  0 users,  load average: 173.64, 173.80, 158.76
 18:01:06 up 18:44,  0 users,  load average: 132.52, 140.94, 135.43
 18:01:06 up 18:44,  0 users,  load average: 166.17, 151.68, 135.23
 18:01:06 up 18:44,  0 users,  load average: 170.14, 164.03, 145.31

The AWS m1.medium is a single CPU instance.

$ cat /proc/cpuinfo
processor	: 0
vendor_id	: GenuineIntel
cpu family	: 6
model		: 45
model name	: Intel(R) Xeon(R) CPU E5-2650 0 @ 2.00GHz
stepping	: 7
cpu MHz		: 1800.000
cache size	: 20480 KB
fpu		: yes
fpu_exception	: yes
cpuid level	: 13
wp		: yes
flags		: fpu de tsc msr pae cx8 cmov pat clflush mmx fxsr sse sse2 ss ht syscall nx lm up rep_good aperfmperf unfair_spinlock pni pclmulqdq ssse3 cx16 sse4_1 sse4_2 x2apic popcnt aes hypervisor lahf_lm arat epb xsaveopt pln pts dts
bogomips	: 3600.00
clflush size	: 64
cache_alignment	: 64
address sizes	: 46 bits physical, 48 bits virtual
power management:

Monitoring an online MySQL ALTER TABLE using Performance Schema

Recently a client asked me how long it would take for an ALTER TABLE to complete. Generally the answer is “it depends”. While this was running on a production system I tried with the Performance Schema in MySQL 5.6 to work out some answer to this question. While I never got to investigate various tests using INPLACE and COPY for comparison, Morgan Tocker made the request for experiences with online ALTER in A closer look at Online DDL in MySQL 5.6. Hopefully somebody with more time can expand on my preliminary observations.

Using Mark Leith’s ps_helper (older version) I monitored the File I/O to see if I could determine when using innodb_file_per_table the percentage of table writing to be completed.

Other data access on this slave server was disabled, so these results represent the I/O of a single ALTER TABLE statement.

  • We can clearly see the reading of the Txxxxxxxxxxxxxx.ibd table,starting at 4.03G, then 7.79G, and following that a peak of 9.75 GB.
  • We see the writing of Txxxxxxxxxxxxxx.ibd in the last samples, and it completes 9.85 GB, the “write_pct” is shows ~50%, a good indicator of a total read and write of the table
  • What we also see is an “Innodb Merge Temp File” which is initially all writes, an indication of what may be a “copy”, however what is *interesting* is the amount of reads and writes are 6X the size of the underlying table
  • Recall that this server is effectively *idle*, so there is no need to be keeping version information of actual table changes
  • This “Innodb Merge Temp File” also works in 1MB chunks, so comparing the “count” values between the base table of 16K operations can be misleading if you just look at count deltas during the process.

Given more time, I would have performed more extensive monitoring including timestamps, and run a test using the COPY algorithm to see if this took less time.

Sample 1

mysql> select * from ps_helper.io_global_by_file_by_bytes limit 10;
+---------------------------------------------+------------+------------+-----------+-------------+---------------+-----------+-----------+-----------+
| file                                        | count_read | total_read | avg_read  | count_write | total_written | avg_write | total     | write_pct |
+---------------------------------------------+------------+------------+-----------+-------------+---------------+-----------+-----------+-----------+
| @@datadir/nsikeyword/Txxxxxxxxxxxxxx.ibd    |     264207 | 4.03 GiB   | 16.00 KiB |         191 | 2.98 MiB      | 16.00 KiB | 4.03 GiB  |      0.07 |
| @@datadir/Innodb Merge Temp File            |          0 | 0 bytes    | 0 bytes   |        1912 | 1.87 GiB      | 1.00 MiB  | 1.87 GiB  |    100.00 |
| @@datadir/ibdata1                           |        412 | 8.41 MiB   | 20.89 KiB |         693 | 46.52 MiB     | 68.73 KiB | 54.92 MiB |     84.69 |
| @@datadir/ib_logfile1                       |          2 | 64.50 KiB  | 32.25 KiB |       16670 | 11.92 MiB     | 750 bytes | 11.98 MiB |     99.47 |
| /mysql/binlog/mysql-relay-bin.003236        |        749 | 5.85 MiB   | 8.00 KiB  |       49943 | 5.85 MiB      | 123 bytes | 11.70 MiB |     50.00 |
| @@datadir/mysql/slave_master_info.ibd       |          4 | 64.00 KiB  | 16.00 KiB |           0 | 0 bytes       | 0 bytes   | 64.00 KiB |      0.00 |
| @@datadir/mysql/slave_relay_log_info.ibd    |          4 | 64.00 KiB  | 16.00 KiB |           0 | 0 bytes       | 0 bytes   | 64.00 KiB |      0.00 |
| @@datadir/mysql/slave_worker_info.ibd       |          4 | 64.00 KiB  | 16.00 KiB |           0 | 0 bytes       | 0 bytes   | 64.00 KiB |      0.00 |
+---------------------------------------------+------------+------------+-----------+-------------+---------------+-----------+-----------+-----------+

Sample 2

mysql> select * from ps_helper.io_global_by_file_by_bytes limit 10;
+---------------------------------------------+------------+------------+-----------+-------------+---------------+-----------+-----------+-----------+
| file                                        | count_read | total_read | avg_read  | count_write | total_written | avg_write | total     | write_pct |
+---------------------------------------------+------------+------------+-----------+-------------+---------------+-----------+-----------+-----------+
| @@datadir/nsikeyword/Txxxxxxxxxxxxxx.ibd    |     510483 | 7.79 GiB   | 16.00 KiB |         191 | 2.98 MiB      | 16.00 KiB | 7.79 GiB  |      0.04 |
| @@datadir/Innodb Merge Temp File            |          0 | 0 bytes    | 0 bytes   |        3517 | 3.43 GiB      | 1.00 MiB  | 3.43 GiB  |    100.00 |
| @@datadir/ibdata1                           |        412 | 8.41 MiB   | 20.89 KiB |         693 | 46.52 MiB     | 68.73 KiB | 54.92 MiB |     84.69 |
| @@datadir/ib_logfile1                       |          2 | 64.50 KiB  | 32.25 KiB |       16670 | 11.92 MiB     | 750 bytes | 11.98 MiB |     99.47 |
| /mysql/binlog/mysql-relay-bin.003236        |        749 | 5.85 MiB   | 8.00 KiB  |       49943 | 5.85 MiB      | 123 bytes | 11.70 MiB |     50.00 |
| @@datadir/mysql/slave_master_info.ibd       |          4 | 64.00 KiB  | 16.00 KiB |           0 | 0 bytes       | 0 bytes   | 64.00 KiB |      0.00 |
| @@datadir/mysql/slave_relay_log_info.ibd    |          4 | 64.00 KiB  | 16.00 KiB |           0 | 0 bytes       | 0 bytes   | 64.00 KiB |      0.00 |
| @@datadir/mysql/slave_worker_info.ibd       |          4 | 64.00 KiB  | 16.00 KiB |           0 | 0 bytes       | 0 bytes   | 64.00 KiB |      0.00 |
+---------------------------------------------+------------+------------+-----------+-------------+---------------+-----------+-----------+-----------+

Sample 3

mysql> select * from ps_helper.io_global_by_file_by_bytes limit 10;
+---------------------------------------------+------------+------------+-----------+-------------+---------------+-----------+------------+-----------+
| file                                        | count_read | total_read | avg_read  | count_write | total_written | avg_write | total      | write_pct |
+---------------------------------------------+------------+------------+-----------+-------------+---------------+-----------+------------+-----------+
| @@datadir/Innodb Merge Temp File            |      19503 | 19.05 GiB  | 1.00 MiB  |       23798 | 23.24 GiB     | 1.00 MiB  | 42.29 GiB  |     54.96 |
| @@datadir/nsikeyword/Txxxxxxxxxxxxxx.ibd    |     638920 | 9.75 GiB   | 16.00 KiB |         191 | 2.98 MiB      | 16.00 KiB | 9.75 GiB   |      0.03 |
| @@datadir/ibdata1                           |        412 | 8.41 MiB   | 20.89 KiB |         693 | 46.52 MiB     | 68.73 KiB | 54.92 MiB  |     84.69 |
| @@datadir/ib_logfile1                       |          2 | 64.50 KiB  | 32.25 KiB |       16670 | 11.92 MiB     | 750 bytes | 11.98 MiB  |     99.47 |
| /mysql/binlog/mysql-relay-bin.003236        |        749 | 5.85 MiB   | 8.00 KiB  |       49943 | 5.85 MiB      | 123 bytes | 11.70 MiB  |     50.00 |
| @@datadir/mysql/proc.MYD                    |        692 | 423.96 KiB | 627 bytes |           0 | 0 bytes       | 0 bytes   | 423.96 KiB |      0.00 |
| @@datadir/mysql/slave_master_info.ibd       |          4 | 64.00 KiB  | 16.00 KiB |           0 | 0 bytes       | 0 bytes   | 64.00 KiB  |      0.00 |
| @@datadir/mysql/slave_relay_log_info.ibd    |          4 | 64.00 KiB  | 16.00 KiB |           0 | 0 bytes       | 0 bytes   | 64.00 KiB  |      0.00 |
+---------------------------------------------+------------+------------+-----------+-------------+---------------+-----------+------------+-----------+

Sample 4

mysql> select * from ps_helper.io_global_by_file_by_bytes limit 10;
+---------------------------------------------+------------+------------+-----------+-------------+---------------+-----------+------------+-----------+
| file                                        | count_read | total_read | avg_read  | count_write | total_written | avg_write | total      | write_pct |
+---------------------------------------------+------------+------------+-----------+-------------+---------------+-----------+------------+-----------+
| @@datadir/Innodb Merge Temp File            |      36865 | 36.00 GiB  | 1.00 MiB  |       41160 | 40.20 GiB     | 1.00 MiB  | 76.20 GiB  |     52.75 |
| @@datadir/nsikeyword/Txxxxxxxxxxxxxx.ibd    |     638920 | 9.75 GiB   | 16.00 KiB |         191 | 2.98 MiB      | 16.00 KiB | 9.75 GiB   |      0.03 |
| @@datadir/ibdata1                           |        412 | 8.41 MiB   | 20.89 KiB |         693 | 46.52 MiB     | 68.73 KiB | 54.92 MiB  |     84.69 |
| @@datadir/ib_logfile1                       |          2 | 64.50 KiB  | 32.25 KiB |       16670 | 11.92 MiB     | 750 bytes | 11.98 MiB  |     99.47 |
| /mysql/binlog/mysql-relay-bin.003236        |        749 | 5.85 MiB   | 8.00 KiB  |       49943 | 5.85 MiB      | 123 bytes | 11.70 MiB  |     50.00 |
| @@datadir/mysql/proc.MYD                    |        692 | 423.96 KiB | 627 bytes |           0 | 0 bytes       | 0 bytes   | 423.96 KiB |      0.00 |
| @@datadir/mysql/slave_master_info.ibd       |          4 | 64.00 KiB  | 16.00 KiB |           0 | 0 bytes       | 0 bytes   | 64.00 KiB  |      0.00 |
| @@datadir/mysql/slave_relay_log_info.ibd    |          4 | 64.00 KiB  | 16.00 KiB |           0 | 0 bytes       | 0 bytes   | 64.00 KiB  |      0.00 |
+---------------------------------------------+------------+------------+-----------+-------------+---------------+-----------+------------+-----------+

Sample 5

mysql> select * from ps_helper.io_global_by_file_by_bytes limit 10;
+---------------------------------------------+------------+------------+-----------+-------------+---------------+------------+------------+-----------+
| file                                        | count_read | total_read | avg_read  | count_write | total_written | avg_write  | total      | write_pct |
+---------------------------------------------+------------+------------+-----------+-------------+---------------+------------+------------+-----------+
| @@datadir/Innodb Merge Temp File            |      57009 | 55.67 GiB  | 1.00 MiB  |       60144 | 58.73 GiB     | 1.00 MiB   | 114.41 GiB |     51.34 |
| @@datadir/nsikeyword/Txxxxxxxxxxxxxx.ibd    |     638922 | 9.75 GiB   | 16.00 KiB |       92839 | 2.56 GiB      | 28.88 KiB  | 12.31 GiB  |     20.78 |
| @@datadir/ibdata1                           |        412 | 8.41 MiB   | 20.89 KiB |        8081 | 1.44 GiB      | 186.98 KiB | 1.45 GiB   |     99.43 |
| @@datadir/ib_logfile0                       |          4 | 3.50 KiB   | 896 bytes |        4443 | 845.59 MiB    | 194.89 KiB | 845.60 MiB |    100.00 |
| @@datadir/ib_logfile1                       |          2 | 64.50 KiB  | 32.25 KiB |       19327 | 735.53 MiB    | 38.97 KiB  | 735.60 MiB |     99.99 |
| /mysql/binlog/mysql-relay-bin.003236        |        749 | 5.85 MiB   | 8.00 KiB  |       49943 | 5.85 MiB      | 123 bytes  | 11.70 MiB  |     50.00 |
| @@datadir/mysql/proc.MYD                    |        696 | 426.43 KiB | 627 bytes |           0 | 0 bytes       | 0 bytes    | 426.43 KiB |      0.00 |
| @@datadir/mysql/slave_master_info.ibd       |          4 | 64.00 KiB  | 16.00 KiB |           0 | 0 bytes       | 0 bytes    | 64.00 KiB  |      0.00 |
+---------------------------------------------+------------+------------+-----------+-------------+---------------+------------+------------+-----------+

Sample 6

mysql> select * from ps_helper.io_global_by_file_by_bytes limit 10;
+---------------------------------------------+------------+------------+-----------+-------------+---------------+------------+------------+-----------+
| file                                        | count_read | total_read | avg_read  | count_write | total_written | avg_write  | total      | write_pct |
+---------------------------------------------+------------+------------+-----------+-------------+---------------+------------+------------+-----------+
| @@datadir/Innodb Merge Temp File            |      60144 | 58.73 GiB  | 1.00 MiB  |       60144 | 58.73 GiB     | 1.00 MiB   | 117.47 GiB |     50.00 |
| @@datadir/nsikeyword/Txxxxxxxxxxxxxx.ibd    |     638922 | 9.75 GiB   | 16.00 KiB |      348927 | 9.85 GiB      | 29.61 KiB  | 19.60 GiB  |     50.27 |
| @@datadir/ibdata1                           |        427 | 8.64 MiB   | 20.72 KiB |       31941 | 5.30 GiB      | 173.84 KiB | 5.30 GiB   |     99.84 |
| @@datadir/ib_logfile0                       |          4 | 3.50 KiB   | 896 bytes |       15763 | 2.97 GiB      | 197.34 KiB | 2.97 GiB   |    100.00 |
| @@datadir/ib_logfile1                       |          2 | 64.50 KiB  | 32.25 KiB |       29864 | 2.72 GiB      | 95.62 KiB  | 2.72 GiB   |    100.00 |
| /mysql/binlog/mysql-relay-bin.003236        |        749 | 5.85 MiB   | 8.00 KiB  |       49943 | 5.85 MiB      | 123 bytes  | 11.70 MiB  |     50.00 |
| @@datadir/mysql/proc.MYD                    |        700 | 428.89 KiB | 627 bytes |           0 | 0 bytes       | 0 bytes    | 428.89 KiB |      0.00 |
| @@datadir/mysql/innodb_index_stats.ibd      |          5 | 80.00 KiB  | 16.00 KiB |           1 | 16.00 KiB     | 16.00 KiB  | 96.00 KiB  |     16.67 |
+---------------------------------------------+------------+------------+-----------+-------------+---------------+------------+------------+-----------+

The lack of good Internet access in the US

The state of high speed internet providers in the “Capital of the World” is rather woeful. Located in Queens, only a few miles from Manhattan leaves you few choices. Always plenty of ads, but options like Verizon FiOS are not available.

There is basically a monopoly with Time Warner Cable, and while the service is generally reliable, the falseness of pricing and options is criminal.

First of all I could not raise an individual via Chat Online, I was forced to call, wait, provide my details, then be told by an individual he could not do anything, I get transferred, then have to provide all my details again. That’s the *HUGE* failure in customer service. You already know my phone number and account details, why do I have to give my phone number, name, address and account number multiple times.

I wanted to save money, but they only wanted me to pay more. Infact, I was offered a package at double what I was paying for now. If I stated I wanted to save money, why would I be dumb enough to pay more. In the end I was offered an upgrade at no charge for 6 months, but of course after that my bill will go up another $10 per month. Did I gain anything or was I, the consumer, screwed over.

Why does this service suck so much. In Australia,

MySQL shutdown via service reporting ERROR

Working with MySQL 5.6 under CentOS 6.4 I came across the following problem with MySQL reporting it did not shutdown successfully.

$ sudo su -
$ service mysql stop
Shutting down MySQL................................................................................................................................................................................................................................................................................................
.........................................................................................................................................................................................................................................................................................................
.........................................................................................................................................................................................................................................................................................................
................. ERROR!

However, you have to look into the problem in the all important MySQL Error Log where I found a different story.

$ tail -100 /mysql/log/error.log
...
2013-11-04 14:43:40 32351 [Note] Shutting down plugin 'INNODB_LOCK_WAITS'
2013-11-04 14:43:40 32351 [Note] Shutting down plugin 'INNODB_LOCKS'
2013-11-04 14:43:40 32351 [Note] Shutting down plugin 'INNODB_TRX'
2013-11-04 14:43:40 32351 [Note] Shutting down plugin 'InnoDB'
2013-11-04 14:43:40 32351 [Note] InnoDB: FTS optimize thread exiting.
2013-11-04 14:43:40 32351 [Note] InnoDB: Starting shutdown...
2013-11-04 14:44:41 32351 [Note] InnoDB: Waiting for page_cleaner to finish flushing of buffer pool
2013-11-04 14:45:41 32351 [Note] InnoDB: Waiting for page_cleaner to finish flushing of buffer pool
2013-11-04 14:46:41 32351 [Note] InnoDB: Waiting for page_cleaner to finish flushing of buffer pool
2013-11-04 14:47:41 32351 [Note] InnoDB: Waiting for page_cleaner to finish flushing of buffer pool
2013-11-04 14:48:41 32351 [Note] InnoDB: Waiting for page_cleaner to finish flushing of buffer pool
2013-11-04 14:49:41 32351 [Note] InnoDB: Waiting for page_cleaner to finish flushing of buffer pool
2013-11-04 14:50:42 32351 [Note] InnoDB: Waiting for page_cleaner to finish flushing of buffer pool
2013-11-04 14:51:42 32351 [Note] InnoDB: Waiting for page_cleaner to finish flushing of buffer pool
2013-11-04 14:52:42 32351 [Note] InnoDB: Waiting for page_cleaner to finish flushing of buffer pool
2013-11-04 14:53:42 32351 [Note] InnoDB: Waiting for page_cleaner to finish flushing of buffer pool
2013-11-04 14:54:42 32351 [Note] InnoDB: Waiting for page_cleaner to finish flushing of buffer pool
2013-11-04 14:55:42 32351 [Note] InnoDB: Waiting for page_cleaner to finish flushing of buffer pool
2013-11-04 14:56:43 32351 [Note] InnoDB: Waiting for page_cleaner to finish flushing of buffer pool
2013-11-04 14:57:43 32351 [Note] InnoDB: Waiting for page_cleaner to finish flushing of buffer pool
2013-11-04 14:58:43 32351 [Note] InnoDB: Waiting for page_cleaner to finish flushing of buffer pool
2013-11-04 14:59:43 32351 [Note] InnoDB: Waiting for page_cleaner to finish flushing of buffer pool
2013-11-04 15:00:43 32351 [Note] InnoDB: Waiting for page_cleaner to finish flushing of buffer pool
2013-11-04 15:01:43 32351 [Note] InnoDB: Waiting for page_cleaner to finish flushing of buffer pool
2013-11-04 15:02:01 32351 [Note] InnoDB: Shutdown completed; log sequence number 109188218872
2013-11-04 15:02:01 32351 [Note] Shutting down plugin 'MRG_MYISAM'
2013-11-04 15:02:01 32351 [Note] Shutting down plugin 'CSV'
2013-11-04 15:02:01 32351 [Note] Shutting down plugin 'MEMORY'
2013-11-04 15:02:01 32351 [Note] Shutting down plugin 'MyISAM'
2013-11-04 15:02:01 32351 [Note] Shutting down plugin 'sha256_password'
2013-11-04 15:02:01 32351 [Note] Shutting down plugin 'mysql_old_password'
2013-11-04 15:02:01 32351 [Note] Shutting down plugin 'mysql_native_password'
2013-11-04 15:02:01 32351 [Note] Shutting down plugin 'binlog'
2013-11-04 15:02:01 32351 [Note] /usr/sbin/mysqld: Shutdown complete

131104 15:02:01 mysqld_safe mysqld from pid file /var/run/mysqld/mysql.pid ended

The log indicates that the server is actually shutdown, an attempt to try again results in

$ service mysql stop
 ERROR! MySQL server PID file could not be found!

Doing some more investigation to pinpoint if the issue is “service” (i.e. “init.d”) related, I found that the command took suspiciously exactly 15 minutes (on several occasions) and MySQL was indeed not shutdown. For example:

$ sudo su -
$ time service mysql stop; tail /mysql/log/error.log
Shutting down MySQL................................................................................................................................................................................................................................................................................................
..........................................................................................................................................................................................................................................................................................................
..........................................................................................................................................................................................................................................................................................................
................ ERROR!

real	15m4.003s
user	0m0.561s
sys	0m2.194s
2013-11-06 16:50:37 19887 [Note] InnoDB: Waiting for page_cleaner to finish flushing of buffer pool
2013-11-06 16:51:38 19887 [Note] InnoDB: Waiting for page_cleaner to finish flushing of buffer pool
2013-11-06 16:52:38 19887 [Note] InnoDB: Waiting for page_cleaner to finish flushing of buffer pool
2013-11-06 16:53:38 19887 [Note] InnoDB: Waiting for page_cleaner to finish flushing of buffer pool
2013-11-06 16:54:38 19887 [Note] InnoDB: Waiting for page_cleaner to finish flushing of buffer pool
2013-11-06 16:55:38 19887 [Note] InnoDB: Waiting for page_cleaner to finish flushing of buffer pool
2013-11-06 16:56:39 19887 [Note] InnoDB: Waiting for page_cleaner to finish flushing of buffer pool
2013-11-06 16:57:39 19887 [Note] InnoDB: Waiting for page_cleaner to finish flushing of buffer pool
2013-11-06 16:58:39 19887 [Note] InnoDB: Waiting for page_cleaner to finish flushing of buffer pool
2013-11-06 16:59:39 19887 [Note] InnoDB: Waiting for page_cleaner to finish flushing of buffer pool

However, waiting it did indeed complete successfully.

tail -f /mysql/log/error.log
2013-11-06 16:51:38 19887 [Note] InnoDB: Waiting for page_cleaner to finish flushing of buffer pool
2013-11-06 16:52:38 19887 [Note] InnoDB: Waiting for page_cleaner to finish flushing of buffer pool
2013-11-06 16:53:38 19887 [Note] InnoDB: Waiting for page_cleaner to finish flushing of buffer pool
2013-11-06 16:54:38 19887 [Note] InnoDB: Waiting for page_cleaner to finish flushing of buffer pool
2013-11-06 16:55:38 19887 [Note] InnoDB: Waiting for page_cleaner to finish flushing of buffer pool
2013-11-06 16:56:39 19887 [Note] InnoDB: Waiting for page_cleaner to finish flushing of buffer pool
2013-11-06 16:57:39 19887 [Note] InnoDB: Waiting for page_cleaner to finish flushing of buffer pool
2013-11-06 16:58:39 19887 [Note] InnoDB: Waiting for page_cleaner to finish flushing of buffer pool
2013-11-06 16:59:39 19887 [Note] InnoDB: Waiting for page_cleaner to finish flushing of buffer pool
2013-11-06 17:00:39 19887 [Note] InnoDB: Waiting for page_cleaner to finish flushing of buffer pool
2013-11-06 17:01:39 19887 [Note] InnoDB: Waiting for page_cleaner to finish flushing of buffer pool
2013-11-06 17:02:40 19887 [Note] InnoDB: Waiting for page_cleaner to finish flushing of buffer pool
2013-11-06 17:03:03 19887 [Note] InnoDB: Shutdown completed; log sequence number 109974145720
2013-11-06 17:03:03 19887 [Note] Shutting down plugin 'MRG_MYISAM'
2013-11-06 17:03:03 19887 [Note] Shutting down plugin 'CSV'
2013-11-06 17:03:03 19887 [Note] Shutting down plugin 'MEMORY'
2013-11-06 17:03:03 19887 [Note] Shutting down plugin 'MyISAM'
2013-11-06 17:03:03 19887 [Note] Shutting down plugin 'sha256_password'
2013-11-06 17:03:03 19887 [Note] Shutting down plugin 'mysql_old_password'
2013-11-06 17:03:03 19887 [Note] Shutting down plugin 'mysql_native_password'
2013-11-06 17:03:03 19887 [Note] Shutting down plugin 'binlog'
2013-11-06 17:03:03 19887 [Note] /usr/sbin/mysqld: Shutdown complete

131106 17:03:03 mysqld_safe mysqld from pid file /var/run/mysqld/mysql.pid ended

Updating MySQL using official repositories

The announcement of the MySQL Yum repositories was a long overdue request on my wish list. While it was possible to find MySQL at http://public-yum.oracle.com/ it was not the GA version MySQL 5.6. (As I write this post, I check and find that indeed it now appears this may be possible http://public-yum.oracle.com/repo/OracleLinux/OL6/MySQL56/).

I have previously installed MySQL 5.6.13 via rpms downloaded from MySQL Downloads, so I expected the upgrade to be straightforward. Following Chapter 3. Upgrading MySQL with the MySQL Yum Repository I had no success.

$ sudo yum update mysql-server
Loaded plugins: fastestmirror, presto
Loading mirror speeds from cached hostfile
 * base: mirror.lug.udel.edu
 * extras: mirror.cisp.com
 * updates: centos.mirror.constant.com
Setting up Update Process
Package(s) mysql-server available, but not installed.
No Packages marked for Update

Looking at what information is available for the mysql-server package (This is the package name specified at Chapter 1. Installing MySQL on Linux Using the MySQL Yum Repository I find.

$ sudo yum info mysql-server
Loaded plugins: fastestmirror, presto
Loading mirror speeds from cached hostfile
* base: mirror.lug.udel.edu
* extras: mirror.cisp.com
* updates: centos.mirror.constant.com
Installed Packages
Name : MySQL-server
Arch : x86_64
Version : 5.6.13
Release : 1.el6
Size : 235 M
Repo : installed
Summary : MySQL: a very fast and reliable SQL database server
…
Available Packages
Name : mysql-server
Arch : x86_64
Version : 5.1.69
Release : 1.el6_4
Size : 8.7 M
Repo : updates

This DOES NOT actually show what I would expect. I had to in fact search for mysql-community-server (NOTE: I discovered this as a note after the previously mentioned package name This installs the package for MySQL server (mysql-community-server) and also packages).

$ sudo yum info mysql-community-server
Loaded plugins: fastestmirror, presto
Loading mirror speeds from cached hostfile
* base: mirror.lug.udel.edu
* extras: mirror.cisp.com
* updates: centos.mirror.constant.com
Available Packages
Name : mysql-community-server
Arch : x86_64
Version : 5.6.14
Release : 3.el6
Size : 51 M
Repo : mysql-community

I suspect I cannot update this (as it’s not actually installed), which is confirmed with.

$ sudo yum update mysql-community-server
Loaded plugins: fastestmirror, presto
Loading mirror speeds from cached hostfile
 * base: mirror.lug.udel.edu
 * extras: mirror.cisp.com
 * updates: centos.mirror.constant.com
Setting up Update Process
Package(s) mysql-community-server available, but not installed.
No Packages marked for Update

So, I am left wit the option of installing this (again I’m not confident), and again confirmed.

$ sudo yum install mysql-community-server
Loaded plugins: fastestmirror, presto
Loading mirror speeds from cached hostfile
 * base: mirror.lug.udel.edu
 * extras: mirror.cisp.com
 * updates: centos.mirror.constant.com
Setting up Install Process
Resolving Dependencies
--> Running transaction check
---> Package mysql-community-server.x86_64 0:5.6.14-3.el6 will be installed
--> Processing Dependency: mysql-community-common(x86-64) = 5.6.14-3.el6 for package: mysql-community-server-5.6.14-3.el6.x86_64
--> Processing Dependency: mysql-community-client(x86-64) = 5.6.14-3.el6 for package: mysql-community-server-5.6.14-3.el6.x86_64
--> Running transaction check
---> Package mysql-community-client.x86_64 0:5.6.14-3.el6 will be installed
--> Processing Dependency: mysql-community-libs(x86-64) = 5.6.14-3.el6 for package: mysql-community-client-5.6.14-3.el6.x86_64
---> Package mysql-community-common.x86_64 0:5.6.14-3.el6 will be installed
--> Running transaction check
---> Package mysql-community-libs.x86_64 0:5.6.14-3.el6 will be installed
--> Finished Dependency Resolution

Dependencies Resolved

=======================================================================================================================================================================
 Package                                         Arch                            Version                                Repository                                Size
=======================================================================================================================================================================
Installing:
 mysql-community-server                          x86_64                          5.6.14-3.el6                           mysql-community                           51 M
Installing for dependencies:
 mysql-community-client                          x86_64                          5.6.14-3.el6                           mysql-community                           18 M
 mysql-community-common                          x86_64                          5.6.14-3.el6                           mysql-community                          296 k
 mysql-community-libs                            x86_64                          5.6.14-3.el6                           mysql-community                          1.8 M

Transaction Summary
=======================================================================================================================================================================
Install       4 Package(s)

Total download size: 71 M
Installed size: 321 M
Is this ok [y/N]: y
Downloading Packages:
Setting up and reading Presto delta metadata
Processing delta metadata
Package(s) data still to download: 71 M
(1/4): mysql-community-client-5.6.14-3.el6.x86_64.rpm                                                                                           |  18 MB     00:00
(2/4): mysql-community-common-5.6.14-3.el6.x86_64.rpm                                                                                           | 296 kB     00:00
(3/4): mysql-community-libs-5.6.14-3.el6.x86_64.rpm                                                                                             | 1.8 MB     00:00
(4/4): mysql-community-server-5.6.14-3.el6.x86_64.rpm                                                                                           |  51 MB     00:02
-----------------------------------------------------------------------------------------------------------------------------------------------------------------------
Total                                                                                                                                   21 MB/s |  71 MB     00:03
warning: rpmts_HdrFromFdno: V3 DSA/SHA1 Signature, key ID 5072e1f5: NOKEY
Retrieving key from file:///etc/pki/rpm-gpg/RPM-GPG-KEY-mysql
Importing GPG key 0x5072E1F5:
 Userid : MySQL Release Engineering 
 Package: mysql-community-release-el6-3.noarch (@/mysql-community-release-el6-3.noarch)
 From   : /etc/pki/rpm-gpg/RPM-GPG-KEY-mysql
Is this ok [y/N]: y
Running rpm_check_debug
Running Transaction Test


Transaction Check Error:
  file /usr/bin/mysql_config from install of mysql-community-client-5.6.14-3.el6.x86_64 conflicts with file from package MySQL-devel-5.6.13-1.el6.x86_64
  file /usr/bin/mysql from install of mysql-community-client-5.6.14-3.el6.x86_64 conflicts with file from package MySQL-client-5.6.13-1.el6.x86_64
...
  file /usr/share/mysql/errmsg-utf8.txt from install of mysql-community-common-5.6.14-3.el6.x86_64 conflicts with file from package MySQL-server-5.6.13-1.el6.x86_64

Error Summary
-------------

At this time I believe it’s not possible to update from official MySQL rpms to the official yum repository, which is rather disappointing. I would have assumed this was a test case. Hopefully, somebody with better package management skills can shed some light!

MySQL Yum Repository Installation

The following steps were used to Install the MySQL repository.

$ cd /tmp
$ wget http://repo.mysql.com/mysql-community-release-el6-3.noarch.rpm
$ sudo yum localinstall mysql-community-release-el6-3.noarch.rpm
$ sudo yum repolist enabled | grep “mysql-community”

MySQL performance schema threads

A trap for those new to the MySQL Performance Schema is the expectation that thread_id in tables such as events_statements_current matches the id you find in the MySQL processlist. This is NOT TRUE.

If we look at the INFORMATION_SCHEMA.PROCESSLIST table we will find information like:

mysql> select id,db,command,state from information_schema.processlist order by id;
-----------+--------------------+---------+------------------------------------------------------------------+
| id        | db                 | command | state                                                            |
+-----------+--------------------+---------+------------------------------------------------------------------+
|         1 | NULL               | Connect | Slave has read all relay log; waiting for the slave I/O thread t |
|         2 | NULL               | Connect | Waiting for master to send event                                 |
|         5 | NULL               | Sleep   |                                                                  |
|  34404870 | NULL               | Sleep   |                                                                  |
| 106759077 | performance_schema | Sleep   |                                                                  |
| 106904549 | performance_schema | Query   | executing                                                        |
| 107004213 | abc                | Sleep   |                                                                  |
| 107004600 | abc                | Sleep   |                                                                  |
| 107004877 | abc                | Sleep   |                                                                  |
| 107004937 | abc                | Sleep   |                                                                  |
| 107004989 | abc                | Sleep   |                                                                  |
| 107005164 | abc                | Sleep   |                                                                  |
| 107005305 | abc                | Sleep   |                                                                  |
| 107005310 | abc                | Sleep   |                                                                  |
| 107005314 | abc                | Sleep   |                                                                  |
| 107005316 | abc                | Sleep   |                                                                  |
| 107005317 | abc                | Sleep   |                                                                  |
| 107005321 | abc                | Sleep   |                                                                  |
+-----------+--------------------+---------+------------------------------------------------------------------+

However, if I wanted to look at the two slave threads in performance_schema.events_statements_current I will find no matching data.

mysql> select * from performance_schema.events_statements_current where thread_id=1;
Empty set (0.00 sec)
mysql> select * from performance_schema.events_statements_current where thread_id=2;
Empty set (0.00 sec)

In the performance schema, you need to use the threads table in order to determine a match between the processlist and the threads. If we look at the table, you will find information about all the BACKGROUND threads in MySQL.

mysql> select thread_id,name,type,processlist_id from threads;
+-----------+----------------------------------------+------------+----------------+
| thread_id | name                                   | type       | processlist_id |
+-----------+----------------------------------------+------------+----------------+
|         1 | thread/sql/main                        | BACKGROUND |           NULL |
|         2 | thread/innodb/io_handler_thread        | BACKGROUND |           NULL |
|         3 | thread/innodb/io_handler_thread        | BACKGROUND |           NULL |
|         4 | thread/innodb/io_handler_thread        | BACKGROUND |           NULL |
|         5 | thread/innodb/io_handler_thread        | BACKGROUND |           NULL |
|         6 | thread/innodb/io_handler_thread        | BACKGROUND |           NULL |
|         7 | thread/innodb/io_handler_thread        | BACKGROUND |           NULL |
|         8 | thread/innodb/io_handler_thread        | BACKGROUND |           NULL |
|         9 | thread/innodb/io_handler_thread        | BACKGROUND |           NULL |
|        10 | thread/innodb/io_handler_thread        | BACKGROUND |           NULL |
|        11 | thread/innodb/io_handler_thread        | BACKGROUND |           NULL |
|        12 | thread/innodb/io_handler_thread        | BACKGROUND |           NULL |
|        13 | thread/innodb/io_handler_thread        | BACKGROUND |           NULL |
|        14 | thread/innodb/io_handler_thread        | BACKGROUND |           NULL |
|        15 | thread/innodb/io_handler_thread        | BACKGROUND |           NULL |
|        17 | thread/innodb/srv_lock_timeout_thread  | BACKGROUND |           NULL |
|        18 | thread/innodb/srv_error_monitor_thread | BACKGROUND |           NULL |
|        19 | thread/innodb/srv_monitor_thread       | BACKGROUND |           NULL |
|        20 | thread/innodb/srv_master_thread        | BACKGROUND |           NULL |
|        21 | thread/innodb/srv_purge_thread         | BACKGROUND |           NULL |
|        22 | thread/innodb/page_cleaner_thread      | BACKGROUND |           NULL |
|        23 | thread/sql/signal_handler              | BACKGROUND |           NULL |
|        24 | thread/sql/slave_io                    | BACKGROUND |           NULL |
|        25 | thread/sql/slave_sql                   | BACKGROUND |           NULL |
|        28 | thread/sql/one_connection              | FOREGROUND |              5 |
| 107013952 | thread/sql/one_connection              | FOREGROUND |      107013929 |
| 107013989 | thread/sql/one_connection              | FOREGROUND |      107013966 |
| 106759100 | thread/sql/one_connection              | FOREGROUND |      106759077 |
| 107014180 | thread/sql/one_connection              | FOREGROUND |      107014157 |
| 107014291 | thread/sql/one_connection              | FOREGROUND |      107014268 |
| 106904572 | thread/sql/one_connection              | FOREGROUND |      106904549 |
| 107014443 | thread/sql/one_connection              | FOREGROUND |      107014420 |
| 107014490 | thread/sql/one_connection              | FOREGROUND |      107014467 |
| 107014491 | thread/sql/one_connection              | FOREGROUND |      107014468 |
| 107014493 | thread/sql/one_connection              | FOREGROUND |      107014470 |
| 107014497 | thread/sql/one_connection              | FOREGROUND |      107014474 |
| 107014498 | thread/sql/one_connection              | FOREGROUND |      107014475 |
|  34404893 | thread/sql/one_connection              | FOREGROUND |       34404870 |
| 107013233 | thread/sql/one_connection              | FOREGROUND |      107013210 |
+-----------+----------------------------------------+------------+----------------+
39 rows in set (0.00 sec)

While it’s great the performance schema can track the statements executed in the Slave SQL thread (I’ll discuss that later), it’s disappointing that the processlist_id, the one thing that can join our two sources of data other, has not value for the slave threads.

mysql> select * from threads where thread_id=25G
*************************** 1. row ***************************
          THREAD_ID: 25
               NAME: thread/sql/slave_sql
               TYPE: BACKGROUND
     PROCESSLIST_ID: NULL
   PROCESSLIST_USER: NULL
   PROCESSLIST_HOST: NULL
     PROCESSLIST_DB: NULL
PROCESSLIST_COMMAND: NULL
   PROCESSLIST_TIME: 0
  PROCESSLIST_STATE: Slave has read all relay log; waiting for the slave I/O thread t
   PROCESSLIST_INFO: NULL
   PARENT_THREAD_ID: 1
               ROLE: NULL
       INSTRUMENTED: YES
1 row in set (0.00 sec)

For normal queries we can get a relationship between the processlist and the performance schema with:

select p.id,p.db,p.command,p.state,s.*
from information_schema.processlist p
inner join performance_schema.threads t on p.id = t.processlist_id
inner join performance_schema. events_statements_current s using (thread_id)
where p.command='Query'G
...
*************************** 2. row ***************************
                     id: 106904549
                     db: performance_schema
                command: Query
                  state: executing
              THREAD_ID: 106904572
               EVENT_ID: 78
           END_EVENT_ID: NULL
             EVENT_NAME: statement/sql/select
                 SOURCE: mysqld.cc:931
            TIMER_START: 268504759200898000
              TIMER_END: NULL
             TIMER_WAIT: NULL
              LOCK_TIME: 580000000
               SQL_TEXT: select p.id,p.db,p.command,p.state,s.* from information_schema.processlist p inner join performance_schema.threads t on p.id = t.processlist_id inner join performance_schema. events_statements_current s using (thread_id) where p.command='Query'
                 DIGEST: NULL
            DIGEST_TEXT: NULL
         CURRENT_SCHEMA: performance_schema
            OBJECT_TYPE: NULL
          OBJECT_SCHEMA: NULL
            OBJECT_NAME: NULL
  OBJECT_INSTANCE_BEGIN: NULL
            MYSQL_ERRNO: 0
      RETURNED_SQLSTATE: NULL
           MESSAGE_TEXT: NULL
                 ERRORS: 0
               WARNINGS: 0
          ROWS_AFFECTED: 0
              ROWS_SENT: 1
          ROWS_EXAMINED: 0
CREATED_TMP_DISK_TABLES: 1
     CREATED_TMP_TABLES: 1
       SELECT_FULL_JOIN: 2
 SELECT_FULL_RANGE_JOIN: 0
           SELECT_RANGE: 0
     SELECT_RANGE_CHECK: 0
            SELECT_SCAN: 1
      SORT_MERGE_PASSES: 0
             SORT_RANGE: 0
              SORT_ROWS: 0
              SORT_SCAN: 0
          NO_INDEX_USED: 1
     NO_GOOD_INDEX_USED: 0
       NESTING_EVENT_ID: NULL

What causes LOST_EVENTS error in the MySQL binary log?

Using MySQL 5.6.13 under CentOS 6.4, I had a replication failure on one master/slave topology because the master binary log had the following entry that was intentionally written by the MySQL server.

$ mysqlbinlog --start-position=244670849 mysql-bin.000029
...
# at 244670849
#131028 19:31:38 server id 39  end_log_pos 244670906 CRC32 0xc5d084ec
# Incident: LOST_EVENTS
RELOAD DATABASE; # Shall generate syntax error
# at 244670906
...

The question is why? I do not know the answer. Searching online indicates this can occur in a MySQL Cluster environment, and can occur around the use of GRANT statements. Neither of these situations are applicable here. This site runs 4 different master/slave topologies all running the same version, and this has been the only occurrence.

The message, if taken literally could indicate that the master server failed to write all events to the master binary log, but instead of reporting any information (say in the MySQL error log), it basically tells you the binary log (aka the replication stream) is now incomplete and you need to rebuild your entire replication topology. If this is true, then this is a poor explanation, and there is no MySQL documentation I have found to shed light here.

The situation of course does not manifest to the end user on the master (or say monitoring the MySQL error log), but on the slave with a message similar to:

mysql> SHOW SLAVE STATUSG
...
        Relay_Master_Log_File: mysql-bin.000029
          Exec_Master_Log_Pos: 244670849
...
             Slave_IO_Running: Yes
            Slave_SQL_Running: No
                   Last_Errno: 1590
                   Last_Error: The incident LOST_EVENTS occured on the master. Message: error writing to the binary log
...

What appears to happen on the master, is the LOST_EVENTS binary log event is written, the binary logs are flushed, as indicated by the file sizes.

-rw-rw---- 1 mysql mysql 1073742236 Oct 27 23:33 mysql-bin.000027
-rw-rw---- 1 mysql mysql 1073741890 Oct 28 11:28 mysql-bin.000028
-rw-rw---- 1 mysql mysql  244670953 Oct 28 19:31 mysql-bin.000029
-rw-rw---- 1 mysql mysql 1073742184 Oct 29 08:55 mysql-bin.000030

Further analysis of the statements before the event in the master log show nothing of incident. Analysis of the binary logs at the error and subsequently how second timestamps that are identical, so there is no *obvious* loss of operations, but when there are 100s of transactions per second, using second granularity is ineffective.

When confirming there were no events after this position on the slave, and the binary logs had been flushed the solution taken was to reset the slave to the next valid event.

mysql> STOP SLAVE;
mysql> CHANGE MASTER TO MASTER_LOG_FILE='mysql-bin.000030', MASTER_LOG_POS=120;
mysql> START SLAVE:

MySQL/NoSQL/Cloud Conference Latin America

Last week I was a guest speaker at the second annual MySQL/NoSQL/Cloud Conference held in Buenos Aires, Argentina. Thanks to Santiago Lertora from Binlogic who has taken on the responsibility of organizing a event for the MySQL community in South America.

My presentations slides for my 3 talks.

While the MySQL community and ecosystem has changed dramatically over the past 5 years, one thing has remained the same. That is the friendships and relationships forged while working for MySQL Inc/AB as employees. No matter were you are in the world you can spend time talking about the past, present and future with alumni and have good time. Even here in South America there were many including Colin, Giuseppe, Monty, Rich, Gerardo, Vladim and myself.

An unexplained connection experience

The “Too many connections” problem is a common issue with applications using excessive permissions (and those that grant said global permissions). MySQL will always grant a user with SUPER privileges access to a DB to investigate the problem with a SHOW PROCESSLIST and where you can check the limits. I however found the following.

mysql> show global variables like 'max_connections';
+-----------------+-------+
| Variable_name   | Value |
+-----------------+-------+
| max_connections | 2000  |
+-----------------+-------+
1 row in set (0.00 sec)

mysql> show global status like 'max%';
+----------------------+-------+
| Variable_name        | Value |
+----------------------+-------+
| Max_used_connections | 6637  |
+----------------------+-------+
1 row in set (0.00 sec)

How can the max_used_connection exceed max_connections? This is possible because you can dynamically change max_connections in a normal MySQL environment. However ,this is AWS RDS where you cannot change variables dynamically via mysql client. You can via other command line options but this has not happened. Furthermore, this server is using the defauly.mysql.5.5 parameter group to further validate the claim that it has not been changed.

I do not have an answer for the client in this case.

I would also add this as another ding on the usability of RDS in production environments. I was locked out of the DB for a long time, and with no visibility of what was going on. The only options were wait, or restart the server. RDS does not provide this level of visibility of the processlist using a privileged user that could see what was going on. Perhaps an interface they should consider in future.

A friday MongoDB funny

I had to laugh (just a bit) at this on the exhibitor floor at Oracle Open World 2013. There was a large MongoDB presence at the Slot 301. There are a few reasons.
First, the identity crisis remains. There is no MongoDB in the list of exhibitors, it’s 10gen, but where is the 10gen representation in the sign. 99.99% of attendees would not know this.
Second, the first and only slide I saw (as shown below), tries to directly compare implementing a solution to Oracle. The speaker made some comment but I really zoned out quickly. Having worked with MongoDB, even on one of my own projects, contemplated the ROI of being proficient in this for consulting, even discussing at length with the CEO and CTO, and hearing only issues with MongoDB with existing MySQL clients, I have come to the conclusion that MongoDB is a niche product. It’s great for a very particular situation, and absolutely not suitable for general use to replace a relational database (aka something with transactions to start with). A young and eager 10gen employee approached me, all excited to convince me of the savings. My first question to him was, how long have you been working at 10gen? After he responded 6 months, I informed him that I knew more about his product and specifically the ecosystem he was now in.

Finally, it was rather sad to think that 10gen/MongoDB was not interested in exhibiting in the MySQL Connect conference, a competitor product in it’s space. They obviously feel that MySQL is dead, and no longer even a viable competitor in the market space.

I have nothing personal against MongoDB, and it continues to mature as a product, however it’s a niche product with some strengths over a RDBMS in a minority of points. It definitely is not the right product for general OLTP applications.


Additional DB objects in AWS RDS

To expand on Jervin’s Default RDS Account Privileges, RDS for MySQL provides a number of routines and triggers defined the the ‘mysql’ meta schema. These help in various tasks because the SUPER privilege is not provided.

SELECT routine_schema,routine_name
FROM information_schema.routines;
+----------------+-----------------------------------+
| routine_schema | routine_name                      |
+----------------+-----------------------------------+
| mysql          | rds_collect_global_status_history |
| mysql          | rds_disable_gsh_collector         |
| mysql          | rds_disable_gsh_rotation          |
| mysql          | rds_enable_gsh_collector          |
| mysql          | rds_enable_gsh_rotation           |
| mysql          | rds_kill                          |
| mysql          | rds_kill_query                    |
| mysql          | rds_rotate_general_log            |
| mysql          | rds_rotate_global_status_history  |
| mysql          | rds_rotate_slow_log               |
| mysql          | rds_set_configuration             |
| mysql          | rds_set_gsh_collector             |
| mysql          | rds_set_gsh_rotation              |
| mysql          | rds_show_configuration            |
| mysql          | rds_skip_repl_error               |
+----------------+-----------------------------------+
15 rows in set (0.00 sec)

SELECT trigger_schema, trigger_name,
          CONCAT(event_object_schema,'.',event_object_table) AS table_name,
          CONCAT(action_timing,' ',event_manipulation) AS trigger_action
FROM information_schema.triggers;
+----------------+--------------+------------+----------------+
| trigger_schema | trigger_name | table_name | trigger_action |
+----------------+--------------+------------+----------------+
| mysql          | block_proc_u | mysql.proc | BEFORE UPDATE  |
| mysql          | block_proc_d | mysql.proc | BEFORE DELETE  |
| mysql          | block_user_i | mysql.user | BEFORE INSERT  |
| mysql          | block_user_u | mysql.user | BEFORE UPDATE  |
| mysql          | block_user_d | mysql.user | BEFORE DELETE  |
+----------------+--------------+------------+----------------+

MySQL MHA and Perl pathing

I am certainly not a knowledgeable Perl person, however I recently ran into the error Can’t locate MHA/MasterMonitor.pm on Red Hat 6.x. I have installed MySQL MHA on various systems before without any issues.

$ masterha_manager -version
Can't locate MHA/MasterMonitor.pm in @INC (@INC contains: /usr/local/lib64/perl5 /usr/local/share/perl5 /usr/lib64/perl5/vendor_perl /usr/share/perl5/vendor_perl /usr/lib64/perl5 /usr/share/perl5 .) at /usr/bin/masterha_manager line 26.
BEGIN failed--compilation aborted at /usr/bin/masterha_manager line 26.

The issue was that MySQL MHA is not installed in any of the acceptable default paths for this disto default installation.

$ find / -type d -name MHA
/usr/lib/perl5/vendor_perl/MHA

The fix was simple on this OS, but I expect there is a correct Perl approach?

ln -s /usr/lib/perl5/vendor_perl/MHA /usr/lib64/perl5/vendor_perl/
$ cat /etc/*release
Red Hat Enterprise Linux Server release 6.3 (Santiago)

Cloning MySQL 5.6 instances

A tip for all those cloud users that like cloning database servers (as reported in my book Effective MySQL – Replication Techniques in Depth).

Starting with MySQL 5.6, MySQL instances have a UUID. Cloning servers to quickly create slaves will result in the following error message.

mysql> SHOW SLAVE STATUSG
...
  Last_IO_Error: Fatal error: The slave I/O thread stops because master and slave have equal MySQL server UUIDs; these UUIDs must be different for replication to work.
...

The solution is simple. Clear our the file based configuration file (located in the MySQL datadir) and restart the MySQL instance.

$ rm -f /mysql/data/auto.cnf
$ service mysql restart

Unnecessary 3am (emergency) call

Help, the database is on fire. Well, it probably is but the solution may also be easy. Here are a few steps for the part-time MySQL DBA/sysadmin/developer. Total time to address this solution was 2 minutes, the inability to not go back to sleep, not priceless.

First, access to the DB server is possible, and also the mysql command line client. If you are getting “Too Many Connections” read Why GRANT ALL is bad.

Given the message “the database is on fire”, the likely cause is rogue SQL.

mysql> show global variables like 'max_connections';
+-----------------+-------+
| Variable_name   | Value |
+-----------------+-------+
| max_connections | 5000  |
+-----------------+-------+
1 row in set (0.02 sec)

mysql> show global status like 'threads%';
+-------------------+-------+
| Variable_name     | Value |
+-------------------+-------+
| Threads_cached    | 1     |
| Threads_connected | 5001  |
| Threads_created   | 5002  |
| Threads_running   | 5001  |
+-------------------+-------+
4 rows in set (0.01 sec)

Yeah, as expected. A SHOW PROCESSLIST in this situation shows all queries stuck in the state of “query end”, which indicates the obvious problem to me (a disk space problem).

For the record I do not recommend setting max_connections to 5,000. MySQL (and Linux) does not function with 5,000 concurrent connections (especially when they all want to create a disk based temporary table, but that’s another story). What is missing is a maximum threads running configuration option, and applicable coding practices and proactive server connection management to prevent such a situation.

Confirming my suspicions.

$ df -h
Filesystem            Size  Used Avail Use% Mounted on
/dev/xvde             7.9G  2.5G  5.0G  34% /
tmpfs                 7.3G     0  7.3G   0% /dev/shm
/dev/xvdf1            197G   42G  146G  23% /mysql
/dev/xvdh1             99G   94G  8.0K 100% /mysql/binlog

The solution here is simple, you need to remove old binary logs. It is NOT the recommendation you delete the files manually but use PURGE MASTER LOGS. However this produced an error.

mysql> purge master logs to 'mysql-bin.000029';
ERROR 3 (HY000): Error writing file '/mysql/binlog/mysql-bin.index_crash_safe' (Errcode: 28 - No space left on device)

That’s a new message, possibly a new MySQL 5.6 error situation. The only choice now is to remove a physical file first. A suggestion to MySQL engineers. Let’s create this file in normal operations with sufficient blank bytes, enabling MySQL to be able to create the file even when the disk is full, and then avoid manual file manipulation.

$ rm mysql-bin.000002

Then:

mysql> purge master logs to 'mysql-bin.000029';
Query OK, 0 rows affected, 1 warning (1.37 sec)
mysql> show warnings;
+---------+------+---------------------------------------------------------------+
| Level   | Code | Message                                                       |
+---------+------+---------------------------------------------------------------+
| Warning | 1612 | Being purged log /mysql/binlog/mysql-bin.000002 was not found |
+---------+------+---------------------------------------------------------------+
1 row in set (0.01 sec)

As always, a recommendation when problems occur is to check the error log (aka Monitoring the MySQL Error Log). This issue is also immediately apparent.

2013-08-23 06:28:36 30609 [Warning] Disk is full writing '/mysql/binlog/mysql-bin.000097' (Errcode: 28 - No space left on device). Waiting for someone to free space...
2013-08-23 06:28:36 30609 [Warning] Retry in 60 secs. Message reprinted in 600 secs

I would also like to point out that being proactive and having monitoring and instrumentation in ALL startups is critical if you want to be successful. Point 1 in my recommendations of Successful Scalability Principles.

Was it really an emergency?