Data Masking 101

I continue to dig up and share this simple approach for production data masking via SQL to create testing data sets. Time to codify it into a post.

Rather than generating a set of names and data from tools such as Mockaroo, it is more practical to use actual data for a variety of testing reasons.

The SQL below is a self-explanatory approach of removing Personal Identifiable Information (PII), but keeping data relevant. I use this approach for a number of reasons.

  • We are using production data rather than synthetic data. Data volume, distribution, and additional column values are realistic. This is a subset of an example, but dates and locations are therefore realistic
  • Indexes (and unique indexes) still work, and distribution across the index is adequate for searching. Technically the index will be a little larger in disk footprint.
  • You cannot reverse engineer the masked value into a real value with just this data set. An engineer in a test environment cannot obtain the underlying information.
  • If you identify an issue with data quality for any row of data, there is a way to present the uniqueness of that row. This enables a person with production access to match the underlying row. Of course, any unique identifier (auto increment or UUID) should also be modified to mask real data.


SELECT CONCAT(SUBSTR(first_name,1,2),REPEAT('*',LENGTH(first_name)-2)) AS first_name,
CONCAT(SUBSTR(last_name,1,3),REPEAT('*',LENGTH(last_name)-3),' ', SUBSTRING(MD5(CONCAT(first_name,last_name)),1,6)) AS last_name,
CONCAT(SUBSTR(organization,1,3),REPEAT('*',LENGTH(organization)-3),' ', SUBSTRING(MD5(CONCAT(organization)),1,6)) AS organization,
created, country
FROM customer
LIMIT 10;

+------------+--------------------+------------------+---------------------+---------+
| first_name | last_name | organization | created | country |
+------------+--------------------+------------------+---------------------+---------+
| Sa**** | Cor**** 4c23cd | Ski*** d21420 | 2022-09-20 03:30:14 | PH |
| Fu**** | Wat*** 8b97de | Jax***** e629c2 | 2022-04-08 03:20:22 | BY |
| Mo**** | Zis***** b11d94 | Rhy**** b4073a | 2022-10-06 15:58:38 | IR |
| So**** | Bad** 232cc2 | Rhy*** 1734bd | 2022-02-01 07:35:39 | ID |
| Ni***** | Ter***** d9ffb5 | Wor****** 6e476c | 2021-11-08 17:07:34 | IL |
| Ka****** | Scr***** 9201db | Jax**** 481fd8 | 2022-08-18 19:17:54 | BR |
| Li*** | Coz** 0447f6 | Nlo**** 11da59 | 2022-07-29 06:47:56 | HR |
| Ch***** | Hal******** f5d9c8 | Zoo**** c6e07d | 2022-09-28 04:54:30 | UA |
| Er****** | Ste******* d005f2 | Eid** ffc305 | 2022-04-28 18:50:11 | PT |
| Fo** | O'S***** b35c44 | Buz**** 2c8598 | 2022-09-11 02:05:55 | RU |
+------------+--------------------+------------------+---------------------+---------+

A reliable and dependable application requires observability

Observability (o11y) is a critical pre-requisite component in software architecture when advocating for and preparing organizations for making informed decisions on the success of their application. Open Telemetry from the Cloud Native Computing Foundation is the goto standard regardless of your choices of monitoring tools. However, observability is just a building block that I need to explain when advocating for having reliable and dependable systems. Observability will not inform you “Was the customer actually impacted, or how many, or how long?”. Observability will not tell you “the root cause of a problem?”.

My five layers of building blocks for Reliability are:

  1. Observability – The collection of telemetry (metrics, traces and logs) should just be there. If you are using Kubernetes (k8s) and a Java/Python/Node.js application it is already built in. Just do it.
  2. Reproducibility – The ability with a known set of steps and a given configuration and setup you can reproduce an outcome showing the same observed results is a necessary pre-requisite for any feature development or bug fixes.
  3. Testability – After being able to consistently reproduce an observed event with measurable results, the running of various experiments using a variety of changes enables you to adequately test future improvements or corrections to the initial situation, whether it’s a known bug, or a new piece of functionality. Reproducible and consistent testing is an essential component to the release of software for a reliable application.
  4. Scalability – It is impossible to adequately test a system to failure without an observable, reproducible, and testable framework. Many organizations suffer from the management “Can we support X operations” syndrome, when instead the application should know what “X” is automatically, and have adequate safeguards in place to prevent its occurrence. The ability to proactively disable [expensive] features for the good of the entire system is not a common practice for software (aka a dark mode). In fact, many organizations do not even have the capability of customer-level and individual component-level feature flags or related rate limits that can manually be implemented.
  5. Dependability – A reliable, highly available, and dependable application requires all of the prior layers to be in place to give a level of assurance to your customers and your company that your product is dependable.

AWS RDS Aurora wish list

I’ve had this list on a post-it note on my monitor for all of 2022. I figured it was time to write it down, and reuse the space.

In summary, AWS suffers from the same problem that almost every other product does. It sacrifices improved security for backward compatibility of functionality. IMO this is not in the best practices of a data ecosystem that is under constant attack.

  • Storage should be encrypted by default. When you launch an RDS cluster its storage is not encrypted. This goes against their own AWS Well-Architected Framework Section 2 – Security.
  • Plain text passwords. To launch a cluster you must specify a password in plain text on the command line, again not security best practice. At least change this to using a known secret from AWS secrets manager.
  • TLS for administrative accounts should be the only option. The root user should only be REQUIRE SSL (MySQL syntax).
  • Expanding on the AWS secrets manager usage for passwords, there should not need to be lambda code and cloudwatch cron event for rotation, it should just be automatically built in.
  • The awscli has this neat wait command that will block until you can execute the next statement in a series of sequential events to prepare and launch a cluster, but it doesn’t work for create-db-cluster. You have to build in your own manual “wait” until “available” process.
  • In my last position, I was unable to enforce TLS communications to the database from the application. This insecure practice is a more touchy situation, however, there needs to be some way to ensure security best practices over application developer laziness in the future.
  • AWS has internal special flags that only AWS support can set when say you have a bug in a version. Call it a per-client feature flag. However, there is no visibility into what is set, which account, which cluster, etc. Transparency is of value so that the customer knows to get that special flag unset after minor upgrades.
  • When you launch a new RDS Cluster, for example, MySQL 2.x, you get the oldest version, back earlier in the year it was like 2.7.2, even when 2.10.1 was released. AWS should be using a default version when only an engine is specified as a more current version. I would advocate the latest version is not the automatic choice, but it’s better to be more current.
  • the ALTER SYSTEM CRASH functionality is great, but it’s incomplete. You cannot for example crash a global cluster, forcing a region-specific failover. If you have a disaster resiliency plan that is multi-region it’s impossible to actually test it. You can emulate a controlled failover, but this is a different use case to a real failover (aka Dec 2021)
  • Use arn when it’s required not id. This goes back to my earlier point over maximum compatibility over usability, but when a --db-instance-identifier, or --db-instance-identifier requires the value to be the ARN, then the parameter should be specific. IMO –identifier is what you use for that argument, e.g. --db-cluster-identifier. When you specify for example --replication-source-identifier this must be (as per docs) “The Amazon Resource Name (ARN) of the source DB instance or DB cluster if this DB cluster is created as a read replica.” It should then be --replication-source-arn. There are a number of different occurrences of this situation.

Our Data Security Moonshot Starts With Prevention

The recent re-announcement of the Cancer Moonshot highlighted a common enemy to many endeavors to improve our society as a whole, and that is using common sense and already known methods.

At a high level The goal of the Cancer Moonshot Scholars program is to inspire and support the next generation of world-class and diverse researchers focused on scientific breakthroughs that will make a difference for patients and drive progress toward the goal of ending cancer as we know it today. source fact sheet

As stories of this announcement filtered thru news outlets with interviews of medical professionals, a known thread appeared. Both lacking in the message, and the single greatest advancement to the problem, which is already known, is prevention. This includes known prevention measures, early detection measures, and education.

As a Data Strategist, Data Security is a critical component of any business and the single best defense is prevention and using common sense.

Here are just some simple basics that seem to have to be discussed and argued repeatedly company after company, product after product, yet there is no single effort to eliminate these poor practices.

  • No clear text passwords. If you have to enter a password on the command line (cough cough AWS CLI) or put a clear text password in a configuration file (cough cough 100s of products), you enable simple techniques to obtain unvetted access to your data.
  • Using clear text passwords is amplified when products offer a more secure means of access and identity management but they do not employ it everywhere.Check out Password Plaintext Storage
  • Clear text transport. It pains me to say it but even in recent employment that held critical PII data, I could not enforce TLS communication between applications and databases. While it was as simple as a configuration option, the constant excuses by engineering management were it was too hard to implement (cough cough BS).
  • The default configuration settings for a product need to be secure, not the default that is most compatible with prior versions. For example, if you launch a new cloud instance database with defaults, is it the most secure options, or the least secure options>
  • Credential rotation. Long-lived credentials should just be eliminated. Often these are also not named users, but commonly used processes.
  • Communicating passwords in clear text. This should never ever happen, yet it does. Have you ever received an (insecure protocol) email saying here is your username and password? A short known list of 5880+ sites can be found in the https://plaintextoffenders.com/ list on github offenders.csv.
  • Data systems accessible via the public internet For example MongoDB article, MySQL/MariaDB article, Redis & ElasticSearch etc, etc
  • Data systems that have no credentials required
  • Data systems that have default credentials that were never changed
  • Storing passwords in clear text
  • Storing passwords with a single salt
  • Storing passwords with a symmetric encryption approach
  • Administrators that use a common account for “root” privileges, not individual named accounts
  • Not patching products with fixed vulnerabilities CVS Program Mission
  • and the list could go on and on….

In all of the above points, there are numerous examples of these data security anti-patterns. While many are due to the products in use, some of these examples represent poor business practices. It should not have to be explained that most attacks and breaches are internal. The common and very incorrect attitude of, we are within our Virtual Private Cloud (VPC) we do not need to encrypt our data is well, plainly wrong.

Transparency

One of the greatest threats to businesses is ransomware. Attackers gain access to system via various means, those above are just the simplest means and then hold businesses ransom. Ransomware has multiple impacts including the loss of a business operating, the process and time of making a decision, the penalty for payment to release the random, and generally the threat of release of their data if a fine is not paid.

There is a lot to unpack even with this ransomware statement. Can you not restore your entire business operations within a suitable RTO and RPO? Is important data not encrypted. Are passwords in your business able to de-encrypted (this should never even be possible). Do you have a disaster recovery (DR) strategy? Can you access critical data via others means and systems independently?

The stigma of a ransomware attack is organizations do not share this openly. They do not share why it happened, what could have been done to prevent this, and sharing all information with federal authorities that should be tracking all occurrences. This information is an important and critical education feedback loop for the whole industry and IMO lacking of attention. Do you know of a website that shared known ransomware attack vectors.

Conclusion

If security is an important aspect to the data in your organization, can you name the people in your security department? Can any individual point out an insecure product with a known fixed vulnerability? Is that information transparent? Is there a process to address that as a top priority, moving engineering and operations goals accordingly? While organizations may employ an error budget for outages, do they employ a security vulnerability budget? Do companies note version updates of all their software, have people read ALL the release notes of each point release, or even know every version of each software product in use in the organization?

For more information, check out

There will always be better and more determined attempts to attack data systems, we have to stop the most obvious first, and we have to participate in identification and remediation endeavors.

Using a simple relatable example to every person, your home. We should start with not leaving the door open, or leaving the keys in the door or simply removing the door all together.

Spoiler – Owning your data isn’t good enough

While this is a catchy title, if you use Software as a Service (SaaS), or an online cloud provider, do you actually own and have total control of your business data and its infrastructure? For all the free and paid services your business uses, what happens if one day, a portion of that were no longer available?

When you have data in a CRM, an analytics platform, a marketing platform, a payments platform, if one of those service providers locks you out of your data, you have lost control and access to a part of your business. Can you still operate unaffected? What is the actual impact? What is your contingency? You could be lucky and the impact is temporary, such as a day or a week, but it could also be longer or even indefinite.

Let me give you a simple but concrete example. Fellow woodworker Eric of Spencley Design posted recently on YouTube “I just lost half of my business”. If you listen to just 2 1/2 minutes from 12:00 to 14:30 of his youtube video explanation you will understand that this business relies on several online SaaS services. Many are free, but for an unexplained reason, whether bad code, bad ML/AI, or several other plausible reasons, one of his income streams was shut down without notice. This was not by his doing, or any of his actions but for unrelated reasons. Online attempts to appeal this situation caused a permanent suspension. Talking to a human to understand what happened, why it happened, and how this can be resolved, was also unanswered because there is no ability to physically speak to a human.

This problem is not limited to online services. A great example of just a decade ago is your business credit card stops working, transactions are declined. If you were lucky you could physically call your bank manager, or go to your bank manager to get to the bottom of the situation. You knew your bank account contained sufficient funds as you maintained on-premise accounting practices and you could provide evidence of such facts. If you run a small business today, do you think you can talk to a human that would have the ability to correct this problem, or would you have to talk to 5 humans, multiple automated (and annoying) systems, costing countless hours of time and frustration?

If you rely on Acme George Inc workspaces product for your small business email and shared documents, what if that becomes blocked? How do you communicate with your customers? What if you use Acme Archie Inc for your customer support ticketing system, and for a week it is unavailable to use? Not only can your customers not report issues, but you have no access to see what issues were already outstanding and work on them independently.

At times there are widespread outages of online presences that have a wide effect across industries from hours to weeks. Cloudflare Jun 21, 2022, Fastly June 8, 2021, Amazon Web Services Dec 7, 2021, and then Dec 15 and Dec 22. A blog post called it the AWS’s December Outagepalooza. The Atlassian April 2022 outage for paying customers lasted upto 2 weeks. Even a free social media company and its related entities incurred widespread impact Facebook Oct 4 ,2021 that affected many gig economy businesses. These outages can have far ranging effects. Actual examples include you cannot pay your employees, your staff at a hospital cannot authenticate to access patient records, transportation and logistics of your shipping business is halted.

I am referring here to loss of access to your data in a SaaS environment, and loss of cloud infrastructure that supported your SaaS services or even your internally developed and maintained systems running on cloud infrastructure. If you are not convinced of the larger ramifications of an extreme loss of infrastructure services what was the impact to Parler in 2021.

My point here is you cannot simply stop using these services, or your cloud provider(s) infrastructure. You need to be prepared. In a traditional system, you backup your data for some degree of disaster, and you support the capability to recover both infrastructure and data from this, and if you a smart you actually test this. Sidebar a colleague recently shared that even with massive investment in infrastructure and global redundancy, a scheduled test for this large bank took down services for 12 hours.

Large SaaS organizations could offer services that offer multi-region or multi-cloud capabilities, but they are also at the mercy of the SaaS providers they use. Do you know all the interdependencies? Look no further than the wipe out of Okta’s stock (down 30%) in one day. CEO of Okta Todd McKinnon cited several factors including a security impact by text message provider Twilio. Read more about that at Twilio Employeee, Customer Accounts Breached Through Texts. And yes, the headline here has an incorrect spelling. I tried to add a comment to offer feedback, but the MarketWatch paywall of 4 articles would not let me create an account to login to leave a comment!

The solution is not to host all of your own infrastructure either. Facebook’s very long outage was self-inflicted and they controlled all of their own infrastructure. It not only had an impact on their websites, their internal staff were unable to use security badges to access critical infrastructure to correct the problem because they were physically locked out of buildings holding the infrastructure.

Returning to the small business owner who uses a marketing platform, an analytics platform, a CRM, a payment platform or even a social media platform. Do you keep current copies of your data in these systems so that if there were a loss, you knew who to communicate with? In the first cited case, did Eric have a list of all of his subscribers, a copy of all his online content, and all comments made by subscribers. Was there a means to communicate with them via other means, or was access to sufficient PII not even possible for what was his original content?

In future posts I will share some of my techniques for ensuring you have a data acquisition strategy.

What is the right length of a blog post?

A question without a definitive answer. Finding opinions from authoritative sources can also be easily obscured due to search engine optimization or even the choice of words used while searching.

I used the following search terms initially in Google and DuckDuckGo.

  • what is the right size of a blog post
  • what is the ideal length of a blog post

I then started with the term “ideal blog post”, and here are the type-ahead responses. Clearly “length” is the definitive winner in word association. My first thought was “size”, is that a technical difference?

DuckDuckGo

  • ideal blog post length
  • ideal blog post length for seo
  • ideal blog post size
  • ideal blog post length 2021
  • ideal word count for a blog post
  • ideal length for a blog post
  • ideal length of a blog post
  • ideal length for a blog post

NOTE: Size mentioned only once.

Google

  • ideal blog post length
  • ideal blog post length for seo
  • ideal blog post title length
  • ideal blog post length 2022
  • ideal blog post length for seo 2022
  • ideal blog post length 2021
  • ideal blog post length 2020
  • ideal blog post length for seo 2020
  • ideal blog post frequency
  • ideal blog posts

NOTE: Size not mentioned once. As a result the original title of my post was changed from size to length.

Search Outcomes

Using Google, which now often will provide a summarized result (known as a feature snippet) before examples of what People also ask, or ad results that are even before ranked actual results.

what is the right size of a blog post – Google

2,100-2,400 words
For SEO, the ideal blog post length should be 2,100-2,400 words, according to HubSpot data. We averaged the length of our 50 most-read blog posts in 2019, which yielded an average word count of 2,330. Individual blog post lengths ranged from 333 to 5,581 words, with a median length of 2,164 words. Mar 2, 2020

ideal blog post length – Google

about 1,500 to 2,000 words
Although your blog post length may vary depending on your topic and audience, it is often best to aim for about 1,500 to 2,000 words for articles or posts. Longer pieces seem to do better when it comes to ranking on SERPs.

DuckDuckGo

I have not yet seen, nor in these examples is DuckDuckGo creating a single answer summary. Probably IMO a good thing.

what is the right size of a blog post – Bing

Branching out I was curious what other possible engines provided.

1,600 words – According to 2 sources

And then a non copy/paste answer that I had to extract from developer tools

In the infographic “ The Internet is a Zoo: The Ideal Length of Everything Online ” from Buffer, they find that the ideal blog post length is 1,600 words. But some sources think a good blog post should be even longer than that. In a Medium article, the writer says that posts with an average read time of 7 minutes captured the most attention.

According to research done by popular blogging platform, Medium, the ideal length for blog posts is 1,600 words (or seven minutes of reading). This number is based on an analysis of the “average total seconds spent on each post and compared this to the post length.”

ideal blog post length – Bing

To sum up, here’s a list of common blog posts lengths to help you find your own ideal length:

Micro content: 75–300 words. Super-short posts are best for generating discussion. They rarely get many shares on social…
Short-form content: 300–600 words. This is the standard blogging length, recommended by many “expert” bloggers. Shorter…

More …

what is the right size of a blog post – Yahoo

Above the fold, after ads and before People also ask and actual results was

For SEO , the ideal blog post length should be 2,100-2,400 words, according to HubSpot data. We averaged the length of our 50 most-read blog posts in 2019, which yielded an average word count of 2,330. Individual blog post lengths ranged from 333 to 5,581 words, with a median length of 2,164 words.

ideal blog post length – Baidu

As the homepage was all Chinese and I wasn’t sure if I should continue but I cut/pasted english and hit the button and got results in English.

The text of the first search response was something I’d not seen on any other page, so for reference apparently there are Blog styles :)

Ideal Blog Post Length for SEO Blog posts vary in length from a few short paragraphs (Seth Godin style) to 40,000 words (Neil Patel style).

What an SEO SME says

So I reached out to my most knowledgeable friend in SEO and asked them the question Without googling or searching online, based on your SME.

Q: What is the right size of a blog post?
A: You mean content length? 1500 to start, ideally more towards the 5,000 or 10,000

Q: What is the best reading time for a blog post?
A: depends – long form vs short – some times a simple paragraph is all you need. Other times you want a book.

Summary

Using what the engines provide as a single recommendation, not the top organic search result.

Source Response
Google 1,500-2,000 or 2,100-2,400 depending on question
DuckDuckGo -
Bing 1,600 (only to mention time of 7 minutes)
Yahoo 2,100-2,400
Human SEO SME 1,500

Additional Helpers

A recent edition to my short reading email summaries of useful articles is TLDR. While this is not new information the inclusion of 1 minute read, 2 minute read, 11 minute read is useful data to me in making an informed decision based on the factors at the moment. Other information that helps this example which is a newsletter is 300,000 Subscribers and 43% Open Rate. There are also other data points that help, and could narrow your audience and determine what you may consider and ideal size.

Returning to the summarized results of various search engines, only one, Bing, provided this additional measurement of time, and the answer was “average read time of 7 minutes captured the most attention.” which translated into 1,600 words.

I cannot ofter any personal validation of either of these data points, but I should perhaps start collecting it.

Conclusion

What is the answer? Well, only your target audience can inform you of this. The question(s) is then who is your target audience? Is your target audience who you think they are?

For the record, my last blog post was 1973 words long, and this one is 1216 words long, therefore averaging 1594 words. NOTE: These numbers were the original versions length, both of which have changed/evolved over time with additional feedback.

This leads to a more important question. How are you measuring the impact of your blog posts and how does size/length/time play a role in that?

Sidebar: Is a blog post actually the best way for people to read your content, or at least gain insights into what may be useful for your readers. Is a newsletter a better option?

Going back to the TLDR newsletter for a moment, this information can be found on the website.

  1. Highly technical audience, primarily software engineers and other tech workers
  2. 30% United States, 10% United Kingdom, 10% Canada, 25% other EU, 25% other non-EU
  3. 50% ages 25 to 34, 20% ages 18 to 24, 20% ages 35 to 44, 10% other
  4. Primary sponsors get between 1000 to 1250 clicks
  5. Developer sponsors get between 750 to 1000 clicks
  6. Subscribers from companies like: Google, Amazon, Facebook, Apple, … (it’s interesting this is a list of logos, and what order they are in, FWIW)

I do not have access to the data so I am unable to gain more insights as to what is most read articles based on time. Hint: Interesting infographic for TLDR to publish.

I would ask how do they know point 1 and point 3 of my information without additional data mining providing this detail? I provided an @gmail email address, and my location can be determined via IP.

Can a picture replace a text description?

Data visualization, data storytelling, and data lineage are all ways to better describe and visualize a specific situation for a set of data. Generally, I find these techniques are used as a means to uncover or identify information that ultimately pertains to individuals. For example how many sales have we made across time/location/business unit? How many customers do we have? How many social media photos has a person provided over a period of time? Unfortunately, this is not the kind of data that I feel has real-world meaning to me. It doesn’t describe the advancements made in the biomedical field to help fight disease, it doesn’t tell us the amount of energy that we have saved or the amount of energy that we failed to collect and the impact that has locally and globally on our world, or it doesn’t describe valuable human experiences in history about people and places. I find this value in data visualizations of others.

During a recent vacation, I thought about the impact of the visualization of my experiences and just how much information was not collected, and how much information was collected but is of average or poor value or is extremely valuable. How hard it was to collate even what I had collected, and to who or what the value of this information is? While these are personal experiences and not that of a commercial organization, Google certainly informed me of how many people were viewing a public image I uploaded and a comment I made of an iconic Australian location and food.

Inaccessible value in a text description

I recently caught up with a very dear friend. She had lost her husband 10 years ago after more than 50 years of marriage. He kept a written diary every year since 1946, starting a year after the end of world war II that he served it.

So from 1946 to 2012, that is 66 years, there is a wealth of information that includes personal feelings, expectations, and perhaps thoughts about what is going well and what’s not going well. It would also include valuable information about the world view from a very intelligent and influential individual. These diaries are still located today on the same shelf in the same office they have for the short 25 years I was aware.

To draw a conclusion to the question with a data analogy. A single copy, in a single location of un-indexed information, which first-hand sources know has unlocked potential. It is also an immutable and finite time capsule. It would also IMHO contain great value in feelings, emotions, family, and history that is important to a small community. Could a picture represent this data?

A picture

Whilst traveling I used my camera as a means to record the experiences that I was having with my family. I am a photographer and not a videographer so my expression is a picture rather than a video and optionally audio. Sidebar, we did give our child a diary for this vacation to write in, however the attempt to build this new habit only lasted 2 days. Forming new habits can be hard.

But can a picture relay adequate information to describe when and where this photo was taken, why it was taken, how I felt, who I was with, what did it inspire, how did it make me think about related experiences in the past.

Today there is technology now that can take a picture and describe the contents, effectively it could create a summarized description of the picture. With additional metadata such as Exif data where you can extract more details such as time and location. With machine learning you can do picture comparison to identify locations even if location was not specified with the photo.

You can now have AI create an image from a description, if only my Dall-E-2 account would not keep crashing I would try it out.

A picture on its own only contains some value. If you collect all this information and combined with other sources, for example when I used my phone and not my camera, this is stored use google photos. This company can use this information to create a timeline of where you were, when you were there, perhaps you were with and combined with all the sources this company has such as your Google calendar, and Gmail it can and does create a timeline much like the timeline you see in social media platforms such as Facebook if you are regularly user of such a platform.

So we have not a picture, but a collection of pictures, including those not taken or owned by yourself, combined with other structured and unstructured data that can provide an improved timeline.

In comparison in data visualization there is usually a time component for most data. Animated data visualizations which can be awesome usually represent data across time.

Example pictures

Let me give you some simple images as an example and I’ll add some information that is not included in the photos specifically what is available in today’s modern technology such as GPS location. First my existing EOS 5D camera does not provide that information and second I do not enable that on my phone because I want to keep that information private and Google does not provide a capability that would enable me to store personal information but do not share that information for consumption by for example use that information for other machine learning capabilities.

Emu

I had never seen an emu roaming in the wild in Australia before this trip. From a conversation with a friend on a different topic did she provide information that driving between Jeriderie and Narandera you will find emus in the wild. Indeed we did multiple times on this specific highway without having to randomly goto some isolated place hoping for the same outcome.

This is a truly unique animal without only an ostrich looking similar.
Emu in nature, NSW Australia

AWS Rekognition output with values >90% categorize this photo with Antelope, Animal, Mammal, Wildlife, Bird, Sheep, with parents categories of Wildlife, Mammal, Animal. Well that is horribly wrong. An Antelope has 4 legs, this clearly has 2. An Emu is not a Mammal.

AWS Rekognition Response – August 2022. Larger version

That was so bad (and unexpected) I wanted to give the technology another chance with a different emu pic.
Emu in nature, NSW Australia
This time AWS Rekognition output with values >90% describe this photo with Bird, Animal, Emu, Sheep, Mammal, and at 88% Antelope and Wildlife. So if you get Emu (that has two legs), why would you say Sheep which is 4 legs and not a bird? And if you said Emu and Bird, why would you then select Antelope, also with 4 legs, but so not a Bird.

AWS Rekogintion Response – August 2022. Larger version.

Feeling a bit duped by technology, I tried Google Image search next. The first image was recognized as “Tasmanian Emu”. I didn’t know there was such a thing, but it did say Emu and all other related visual matches were Emu. I was surprised it only picked 3 of the 4 animals in the first pic.

The second image was recognized as “Tasmanian emu”, “Emu” and “Common ostrich”. Doh!

Platypus

This next image I was confident AWS Rekognition would be spot on. It’s even a more unique animal, and there are no grass or obstacles to obscure the animal. Boy was I wrong.

Platypus in nature, Eungella QLD Australia

AWS Rekognition output with values >90% describe this photo with Wildlife, Animal, Mammal and at 87% Hippo. It is true that a Hippo is a mammal, and you do find them in water, but?

Platypus in nature, Eungella QLD Australia
Finding an even more evident picture that anybody would recognize, well the software could not. Wildlife, Animal, Mammal. At 85% Lizard, Reptile and Otter. A lizard is not a mammal?

This post is starting to turn into a self proposition even more than I thought.

Had I provided GPS, it would have said Eungella, QLD and any more additional searching would show that it’s a popular destination for finding a Platypus in nature. In-fact a precise GPS location would give the name literally as “Platypus Deck”. here. A human would quickly articulate this by reading text from basic online searches.

Would AWS Rekognition discount values responses if it could know the precise location or even the country. Somehow I feel not.

For what it’s worth, a Google Image Search of Platypus yields tons of pictures AWS should use in it’s recognition validate and ML model.

What this image does not say with whom I was traveling with, that is a local of the area and his comment that in 20 years I’ve not seen platypus as easily and playful as this. It would not describe that on social media, many locals were surprised with the quality of images and videos. It would also not describe what the video shows, how they dive and then burrow into the muddy water using their bill, then rise to the surface and dive again.

Trying Google Image search again, the first image yielded platypus which it is. For the second image, google found no results. Again, I was rather shocked in comparison to the images of platypus a Google Image search shows and the fact this second image showed more detail IMO.

If I correctly label this image with alt text as a platypus, will Google Image search in future show this within search results, or will the output of correct recognition improve at a later time.

Other animals

At this time I decided to give up on animals. An echidna is a unique animal unlike almost any other, a quokka is also, but does resemble a small kangaroo. I do have a hippo, I’ll have to try that out.

Other images

I decided to try some more easier images and I was again overall disappointed and therefore decided to stop adding content here after these two images.

Surfers during summer waves in Oahu

AWS Rekognition above 90% accuracy was Sea, Ocean, Water, Nature, Outdoors, Person, Human, Surfing, Sea Waves, Sport, Sports.
Google Image search gave the first visual response as Viewing summer Swells on Oahu, which is spot on. It was Oahu, not Maui (wonders if I have a surfer image from Maui), and it was more importantly in Summer and not winter which has much larger waves.

Finally I tried to pick one of the most uniquely observable images that you will only find in one location and this image also included readable text.
U.S.S Arizona Memorial at Pearl Harbor Hawaii

AWS Rekognition above 90% was Flag, Symbol, Watercraft, Vessel, Vehicle, Transportation, Waterfront, Water, with Ferry and Boat being 88%. Rather shocked it could not pull out not 1 but 2 specific and clear areas of text and used this. The visible text is “U.S.S ARIZONA MEMORIAL” and “USS ARIZONA BB 39″.

Google Image search described this image as the Pearl Harbor National Memorial which is exactly what it is (in summary).

Even a picture of the Sydney Opera House, a truly unique building did not yield the result of Sydney via AWS Rekognition.

I look forward to this post being indexed to see if Google can give the source of the image as my site. I am also going to have to look into Google APIs for image recognition rather then the very slow and painful web browser option.

In conclusion

To return to the question of this post. Can a picture replace a text description? In short, no. A picture can summarize and quickly convey meaning simply because of how our mind processes visuals but it cannot replace a full text description.

In these examples I would expect almost every reader to be about to summarize these images more accurately, whereas (accessible) machine learning has a very long way to go. Even with location information, only some people would be able to add additional value or better infer an initial description, however all the information I could convey that is of applicable value is not within the picture itself. You cannot interpret additional meaning and value without more context, or without intrinsic knowledge. Using the surfers example, you can find waves used by surfers all around the world. In Oahu specifically in summer, surfable waves are infrequent and small, whereas in winter apparently they are very different.

With data storytelling, a data visualization is going to provide a similar outcome. Better visualizations will contain color and legends that visually describe information more clearly. They will also offer additional insights in creative ways, such as magnifications or clear differentiators. Should photographs as these shown here, automatically contain further context that is shown just in the image. Should image recognition automatically suggest titles that can be further edited by the author? Should an audio summary of the image be able to be recorded with the image? Should any single picture use context of other pictures around locality or time or similarities in the view to build a better picture. It is interesting to consider how technology could improve to provide greater value to the consumer.

How much text is needed is an entirely different question. Is the saying “A picture is worth a 1,000 words” approximately accurate?

Even a complex picture that takes months to review all the detail does not replace a full text description. If you would like an example for comparison checkout the “L. Tellier Kitchen Poster”. A piece of art that I own.

A summer sabbatical

In recent weeks I have been sharing more informal thoughts and in the upcoming weeks, there will be a period of greater radio silence.

After three decades as a professional, I am taking the entire summer off. This will be a chance to intentionally not sit at a desk, stare at a screen, look at my phone, read emails, read articles, and all those other work and personal related activities one does.

Weekly Musings – July 8, 2022

A very succinct description of the responsibilities of leadership by Jawad Nagda (infographic below) shows a number of key features of management that are also needed in data storytelling such as empathy, integrity, and listening. I wish annual 1:1 performance reviews gave employees an opportunity to rate their manager in such detail? It would be an interesting infographic to compare your managers for the past 3-5 jobs visually?

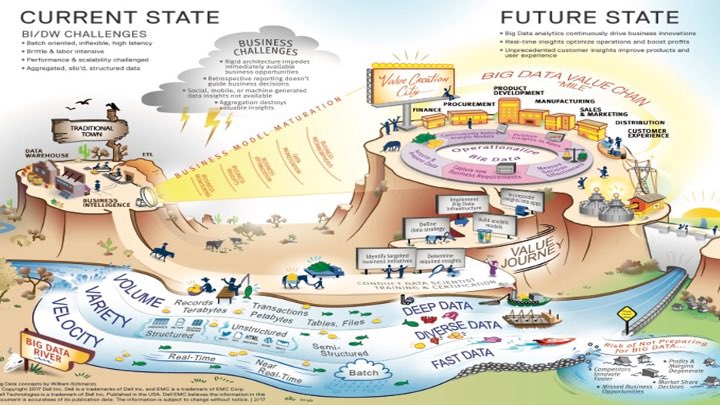
The Data Management Value Realization Journey by Bill Schmarzo really shows the depth and breadth of what an organization needs to be prepared for. The infographic (shown below) provides a lot of detail and each time you look at it from a different perspective you can see a wealth of key terms and thoughts to value. This starts with your data, the velocity, variety, and volume of data, which is described as fast, diverse and deep. The value journey to operationalizing this information clearly outweighs the risks of not being prepared. As much of Sydney is now underwater, and with the frequency of “rain bombs” in Australia, how could your company prepare for an influx of data (a once-in 500-year event)? Could you filter valuable data from invaluable data and draw insights quickly, or would you need to create an infrastructure to do so and train resources? The timeliness of your investment may be too late. The Data Management Value Creation Journey Map should be at the forefront of your business for planning how information drives your business success.

When your computer is idle, is it really idle? Peter Zaitsev shared this article What does an idle CPU do? which is a great read. Reminds me of my very old Unix (yes before Linux) kernel core dump analysis, where I had the Unix source code in question. A computer does not just do nothing unless it’s powered off or sleeping.

AI is used in many different fields. DALL-E 2 is a service that will create art and images based on a description. While this sounds interesting, I consider ML/AI as tools to help improve our society, and our decision-making and remove and replace redundant workloads. I feel creative expression is a talent and gift of an individual and the value of the work is in the eyes of the beholder. DALL-E 2 had to learn by imitating other famous works of art, some artists would learn this way, but some are just naturally talented. Will there be an AI to critique works of art, and how would it describe DALL-2 E’s works?

Speaking of art. I have always been fascinated with water structures and large outdoor works of art. The Bellagio fountain is one example of that. And for those naysays of water usage do your research, this project is actually very water efficient. This video of ultra-slow motion fluid dynamics (2 minutes) is just incredible. (some screenshots below)

Some images of the week.

Volcano + lightning

Weekly Musings – June 10, 2022

A large part of my work week was spent u-hauling across 1/3 of the country. This was a very mentally intense time, indeed 8-10 hrs per day of concentration working with dangerous equipment and sometimes in unpredictable situations with little break was harder than sitting at a desk. I had a lot of time to look at all those trucks on the highway and compose some thoughts about improving our planet. Yes, I did pay $5 per gallon for fuel, and at one stop $150 didn’t even fill the tank.

Easily 50% of all vehicles on the highway were semi-trailer trucks, a cab hauling one or two trailers (henceforth just trucks). If 100 trucks are moving from Point A to Point B, and let’s say it’s 8hr to 16hrs in travel distance, it is highly possible for longer trips you are also away from family. That’s 100 people that are always on, focused on the sole task of driving, you cannot step away for a quick break like in other roles. Electric vehicles will reduce emissions, but that’s not solving the problem. Driverless vehicles will help but that is also decades away from practical use. While 90% of vehicles will remain operated manually for many decades if not always, I see this as an impractical short-term solution.

I had to feel that rail is the obvious alternative here. You can with fewer individuals haul 100 containers, which reduces the human impact. The track is fixed, providing you have the correct support for trains in the opposite directions, so no dealing with the varying speeds of vehicles and crazy drivers. That reduces the mental complexity, and it also reduces the volume of larger vehicles with passenger vehicles. But rail has significant limitations in the change in elevation and direction unlike a road. Any tangible improvement to reduce traffic on highways would work best in areas of flat country. Is this geographical limitation alone a sufficient deterrent.

However, a train goes from point A1 to point B1. It still requires transportation of the container from individual companies’ locations A to A1, and B1 to B. These are much smaller distances and require those 100 drivers, however, they spend less time on the road, less stress on long-hauling, less time away from family. You also cannot just drive the trailer onto a rail car, so there is the complexity, and bottleneck of getting containers onto and off of trains. So is there a way to solve the actual problem of too many vehicles with so much human requirement that also requires concentration and attention, and a volume that is every increasing. The reason this would never work is capitalism. We live in a world where every company wants their own trucks, their own product traveling on their own schedule. Until we stop thinking like 1000s of individual companies and 100s of individual countries to focus on 10s of critical problems facing the planet, I feel the root cause is never actually being tackled. Ironic that in software engineering, the same issue of not tackling the actual root cause in larger strategic ways also occurs.

Changing topics. Let me start with a technical analogy of the following real-life experience.

You have terrible technical debt. They may be known reasons why this occurred in the past, but those reasons and those people are long gone. Yet all subsequent workers suffer from this accumulated technical debt and the impact on product quality and time efficiency is never actually measured or calculated but it should because the impact would be staggering. Vain attempts are made to make some improvements but the amount of technical debt grows, as the number of people writing code grows, the number of varying tools and their apparent effectiveness grows making it all easier to access faster ways of doing things poorly. Highly specialized individuals are hired to help address the problem, but then instead of being able to apply their wisdom to the advertised position, they are subjugated by the few, and either capitulate and are assimilated, or leave feeling worthless and powerless to a solvable problem because of the power and greediness of just those few that try to wield their power. Many may whisper in the shadows or wish for a better situation, but instead, accept the unacceptable normal as the new normal. Soon they have no idea how to relate to what is actually the right thing, except that they believe it is wrong because it’s not what is done now.

I generally refrain from any personal statements, however today I’m going to talk about my closest experience with “Guns in America”. Some facts to start.

  • The US accounts for 4.25% of the world population, let’s say 1/20.
  • The US has between 40% and 50% of the estimated number of guns in the world, so almost 1/2.
  • There are more guns in the US than people. Cite America’s gun culture – in seven charts
  • There are more mass shootings (4 or more wounded by a gun) in 2022 in the US than days in the year
  • I live just 20 minutes away from Sandy Hook. Our church has a memorial for that tragedy. Thankfull have never had to deal with the impact of gun violence..

As a parent, I could not fathom the lifelong anguish for parents of senseless deaths of their children to guns in schools or churches or supermarkets, or hospitals. It is articulated that many gun owners are responsible gun owners, so why does the gun industry, protected from being sued in the country that sues for everything, control the narrative of the safety of humans? I don’t have to be a scholar to read a document that is over 300 years old to see how a few have twisted its meaning, and control the entire population because of it, unwavering in being reasonable that things have changed in 300 years. They certainly afford all the improvements made living in our society in the past 300 years.

My neighbors own guns responsibly. They are also parents. You require a gun license, just like if you were driving a car. They are stored in a locked gun safe, just like you would with other vital possessions or dangerous ones, however this week I came to the realization that many people are not as fortunate.

This week I was at an event, where the circumstances brought me the closest to the real potential of guns in America. Skipping forward from important preamble. I was part of a subsequent conversation with brother B of individual A who asked family member C about his guns. “He has two handguns, one may be in the car (the car he left in that police subsequently arrested him in), he has two shotguns, he has a rifle, like a sniper rifle, that’s big it will be easy to find, and at least 4 semi-automatic machines guns including the AR-15″. Person B was going to collect these items, and they were not secured in any way, so the conversation was where they may be in the home. What happened was individual A wasn’t going to be even arrested, until other ex-law enforcement strongly suggested it happen. This individual was out on bail within a few hours.

This situation could have been very different. Individual A could have left feeling betrayed and returned with weapons of mass destruction. They could have just started out like that. They could have returned home to find their guns gone, and just gone and purchased more, or even possibly just borrowed others easily. I am skipping over a lot of important details as to why this was more of a close call then I am describing.

Guns in America is a complex problem, however when every single recommendation from politicians for fixing the gun problem by doing everything else except tackling the actual root cause, the gun, well that’s insanity. There is simply no other single word. When there is a press conference regarding a terrible mass shooting at a school, and not one single immediate action regarding guns is mentioned, why? My thoughts and prayers are also for all those suffering, but removing machine guns, requiring licenses, requiring background checks, raising the age, limiting the amount of bullets and magazine capacity, not allowing sale of body armor, these are all reasonable requests that still let you own a gun, just like a car. I have to provide proof of Id to buy Sudafed for a cold, but I could walk into a gun show and buy a machine gun. You have to be 21 and show your Id to purchase alcohol, but I can easily get body armor. I was forced to provide my age to buy one container cough medicine from a grocery store, yet you can buy an excessive amount of ammo more easily.

Returning to the technical analogy, it seems the gun problem is just like a technical debt problem. It never goes away, there are always ways to make the increase of technical debt easier. The priority is to add to the technical-debt not to prioritize removing it. In an organizations of 1000s, the few that try to make the world a better place, and constantly battling an ideological world view in software engineering that is well, wrong.

And the week in several images.


Weekly Musings – June 3, 2022

This week I wanted to share more about Observability and the CNCF foundation project Open Telemetry. Observability is a necessary foundation for any information system however observability does not answer questions that are essential for a successful business to operate. Let me explain in more detail.

Observability on it’s own does not answer these questions:

  • Was the customer impacted due to an event?
  • What is the root cause of a customer impacted situation?

So, no matter how much data one can provide here, what is the data story you need to be telling?

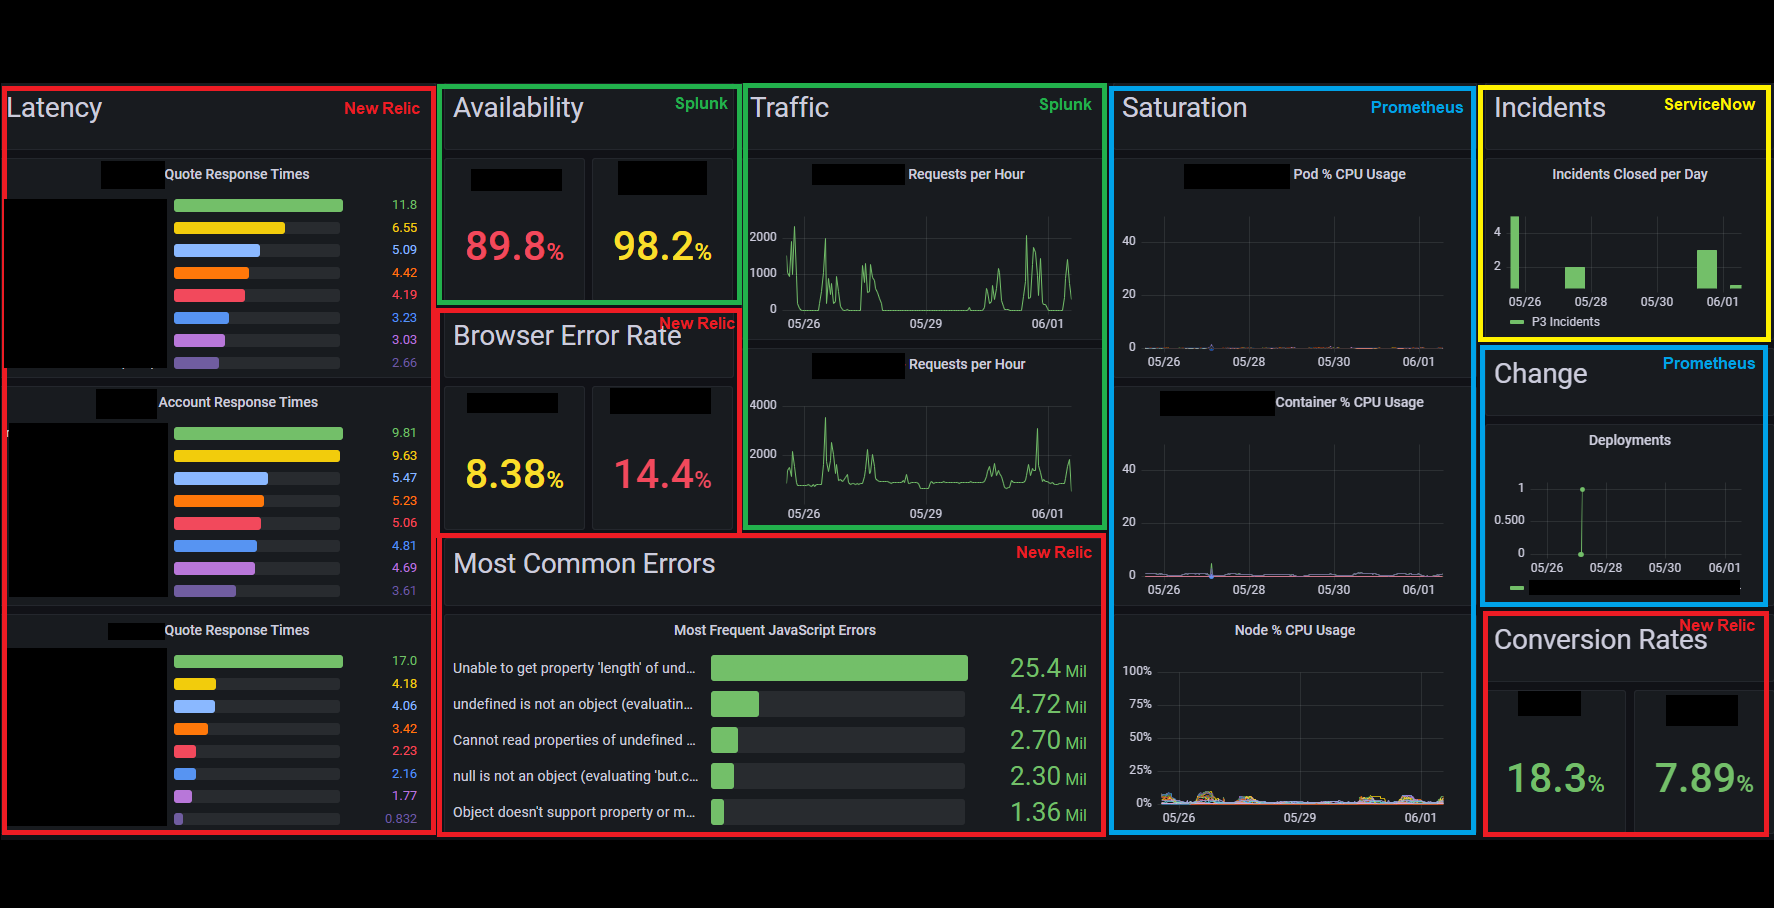
Let me give you a concrete example of a recent actual outage example.  Your cloud provider has an outage at one data center within one availability zone in one region. Your observability shows that 13% of your fleet’s infrastructure is impacted. You employ a multi-AZ single region primary customer-facing website.  While there are alarms and alerts and pages, your infrastructure balances the load, IaC relaunches the necessary replacements and most systems return to an apparent steady-state (I’ll leave the “hint” of apparent for another time).  

Was the customer experience actually impacted?  There are alerts of an increase in 500 errors, however, this quickly resolves. There are some small increases in latency of primary functions that you have on your dashboard? What did the customer actually experience?  Was it just a few customers, all of your customers, or certain customers based on what level of functionality they were performing, for example searching for products to purchase, adding products to a shopping cart, or checking out?

Observability is not going to answer the fundamental question of “Was the customer impacted?”.  Your business needs to define the metrics of measurement and actually capture this. Is a single customer of 100,000 active customers receiving a few 500 errors considered impact? Is 1% of served traffic affected considered impact? What duration?  What is actually necessary are business-specific metrics around your customer sentiment. Is it simply a measurement of revenue per minute compared with seasonal measurements of the same time of day, the same day of the week, and with the same impactful event such as a public holiday. Is it more complicated? No amount of RTO, RPO, MTTD, MTTR, multi-AZ, or DR resiliency is going to help you here.

Let’s take the same situation, but this time the IaC doesn’t work. More alarms are going off, and certain layers of your infrastructure are highly saturated.  Manual attempts to correct the loss of resources do not work? Where is the root cause of the problem? How can you fix the root cause? What if the root cause is a portion of your infrastructure that is a purchased product by another provider, and is a technology stack that does not match your own companies or the skills of your employees? How do you address this “house is on fire” situation?

In the above example, AWS suffered 3 outages last December 2021 and one was the loss of power to a single us-east-1 availability zone.  If you did not know this, us-east-1a for your account does not mean us-east-1a for a different customer of AWS. In fact, it doesn’t even mean the same if you have multiple different accounts per environment.  An availability zone is also not one data center.  Prior incidents have shown that it could be a small percentage. One AWS AZ could comprise 5-10-15+ different data centers.

Also, in the above example, if your container registry is highly-available, but an incorrectly configured third-party product and is now in a state where you cannot re-launch any infrastructure because the necessary images are inaccessible, your business is hobbled.  Have you planned for this situation before?  Let me share some more hypothetical questions about this scenario.  The stack is not what your on-call resources know, there is insufficient documentation about this system, and there is no test infrastructure in order to reproduce the issue, or validate any hypothesis. What if there is no support agreement with the company that sold the product?

As you can see the role of an architect, whether a solutions architect, a data architect, an enterprise architect or the principal architect, you could consider in many organizations this far exceeds the likely scope of your day-to-day obligations.  Is there such a thing as a disaster-preparedness architect, or a chaos architect?  Is the architect not even a sufficiently leveled responsibility here! Is it the Head of, or the Director of need in your business? Is there such a thing as a Chief Reliability Officer (CRO)? Seems a google search finds results. Added to my reading todo list.

My professional experience is that Observability is the first essential layer of total observability infrastructure for your organization.  The full stack actually includes:

  1. Observability
  2. Reproducibility
  3. Testability
  4. Scalability
  5. Reliability

All of these layers are essential. Each layer is a prerequisite for the next.  In your position in the organization where do you start? As a reliability resource you need Observability first. As a test engineer, you actually cannot start with Testability. As a C-suite executive, you need to know that system Reliability comes first, but how to you validate that?

I will be providing a much more in depth paper on this in the future. 

What is also missing from this list is one essential business-wide requirement — Ownership.  If in the entire organization, from the developer to the manager, to the customer support representative to the c-suite officer, every level is needed to take joint ownership in customer success. The weakest link is the actual problem and no amount of instrumentation, process or dashboards can address that.

Moving on, VS Code again came up in conversation in my tech circles, I really should practice using it.

My neighbor purchased the company Steel Bee – Long live your razors. It was a fascinating conversation about not creating a new product, but selecting an existing product that has a drop-ship infrastructure already in place and an Amazon and Shopify store presence. How do you measure the success of something you did not build? How can you improve on it?
 
On a personal note, I am about to venture into the world of CNC routing. Anybody with tips & tricks and open-source software to use? I am currently trying Carbide Create

With all that is happening locally, let us not forget to #StandWithUkraine.

This week in images.


Weekly Musings – May 27, 2022

———

We should all take a moment to reflect that going to school should be a safe, happy, and memorable part of everybody’s life. That was taken away this week from 19 children because common-sense laws, licenses, and checks do not apply to deadly weapons in this country. They apply to get a car license, to require car insurance when purchasing a vehicle, or to purchase Sudafed for a stuffy nose. I reside just 25 minutes from Sandy Hook Elementary school. My church has a memorial for that tragedy. As a parent, I could not comprehend what the grief of loss could be. My prayers to everybody affected in Uvalde, and to all other school districts this year, last year, and all years before that.

———

In recent months I have focussed on improving my data visualization technology skills, and working on my data storytelling skills. 3 Tips You Need to Be Successful in Data Visualization sums this up well.  “Data visualization is not just a skill, it’s a lifestyle. Keep learning and find new ways to get better”. If you are interested, my favorite physical book to date on the subject area is Effective Data Storytelling by Brent Dykes. Great detail, as well as great quotes.  This week Brent has published 100 Essential Data Storytelling Quotes from his book which is a timely affirmation.

How well we communicate is determined not by how well we say things but how well we are understood” — Andrew Grove


More reading and discussion on what is Web 3.0? What does it mean for our field?  What does it mean for my future skills?  The hard truths about Web3: What no one else is talking about was something I read this week after it was recommended by a good friend. The takeaway is in the closing thoughts “Instead, educate yourself on the long-term sustainable use cases of blockchain technology.”. My friends’ takeaway about Blockchain is “It’s a tool, not a solution.” I would tend to agree.

I launched a new project last weekend and I’ve selected for a second time to go with Hugo for a static site generator. If you want a drag and drop template well it’s good, but there is definitely a learning curve if you want to make just minor tweaks. My theme for example said it included Bootstrap, but I wanted to accent a post with a TIP box (in Bootstrap they are called Alerts). Do you think it was trivial to work out why Bootstrap alerts didn’t work in my Hugo template? I spent over an hour because of the complexity of a low-code, no-code solution, whereas if I’d built a site with straight HTML/CSS/JS/Bootstrap it would have just worked. Maybe I’m old school, but clean code and not three levels of abstraction is IMO more maintainable. Does it take longer to be productive? At the start of a new project perhaps, but if you don’t have very technically capable resources that are at your avail, the selection of an internal tool for an essential part of your business may be a poor choice.

As an example. Last year my employer suffered a long outage due to the rough AWS Cloud Dec 2021 with three separate incidents. In one occurrence, the loss of power to a data center that knocked out approximately 7% of one AZ would not be an issue for any organization’s business that runs in a highly available multi-AZ model right? Wrong. The use of a Docker Container Registry product, that was configured has HA went down, along with multiple nodes. Those nodes could not be relaunched because the registry was down. The images could not be rebuilt because they relied on additional images. The entire site was degraded because of one component that was configured in a HA capability, but it was configured incorrectly. To further complicate the matter, the entire stack, from the IAAS to underlying technologies was not part of the stack the DevOps team used, and without clearly documented installation, testing, and chaos experiments. To further complicate the issue, this required obtaining commercial support for the product being used right then, opening a ticket, and getting a support person of said commercial company to help address the issue. The moral here is. If your business relies on it’s availability and you do not have the technical skills and capabilities and redundancies of your staff to ensure its availability, then are you really thinking hard about being prepared, or are you chasing the next sale, the next feature, the next new wave of technology?

Want to get your links to render nicely in the varying products you use? Twitter Card Validator can be a bit of a hit/miss effect. I have found that if I cut/paste a link in chat programs including Slack, Google Chat, and Signal which all provide a different experience but seem to be more responsive. I guess I will keep working on it. (Damm you Hugo!)

On a more personal note and a sore pain point is 401k retirement plans and planning for retirement in the U.S.A. Have you been burned by the 3-year vesting rule of your employer’s matching contributions that you didn’t know about when you looked at the initial offer package? I have. It seems it’s a wide industry problem that affects all levels of employees. Opinion: This giant pension scandal is hiding in plain sight. You are expected to financially plan for retirement only to find that limits, types of plans, and employer decisions put roadblocks in your way.

This week in images.


Weekly Musings – May 20, 2022

The Linux Foundation came across my reading path two separate times this week. As I continue to re-establish my larger footprint solely in the open-source ecosystem Setting an Open Source Strategy is a detailed report for any business to identify the potential return on investment (ROI) of participating in the open-source ecosystem. Every company uses open source. Even if you consume open source in your organization and do not plan to contribute to open source it is a good read to determine what is the inflection point where you (or your employees) may want to invest.

This week I spent some more time looking at the various Open Source Foundations after reading White House joins OpenSSF and the Linux Foundation in securing open-source software. The Open Source Security Foundation (OpenSSF) is a project of the The Linux Foundation. OpenSSF has created the “The Open Source Software Security Mobilization Plan”. This plan lists 10 streams of investment for open source security and I feel it’s important to reiterate these.

  • Security Education – Deliver baseline secure software development education and certification to all.
  • Risk Assessment – Establish a public, vendor-neutral, objective, metrics-based risk assessment dashboard for the top 10,000 (or more) OSS components.
  • Digital Signatures – Accelerate the adoption of digital signatures on software releases.
  • Memory Safety – Eliminate root causes of many vulnerabilities through replacement of non-memory-safe languages.
  • Incident Response – Establish an OpenSSF Incident Response Team of security experts to assist open source projects accelerate their responses to newly discovered vulnerabilities.
  • Better Scanning – Accelerate discovery of new vulnerabilities by maintainers and experts through advanced security tools and expert guidance.
  • Code Audits – Conduct third-party code reviews (and any necessary remediation work) of up to 200 of the most-critical OSS components once per year.
  • Data Sharing – Coordinate industry-wide data sharing to improve the research that helps determine the most critical OSS components.
  • SBOMs Everywhere – Improve SBOM tooling and training to drive adoption.
  • Improved Software Supply Chains – Enhance the 10 most critical OSS build systems, package managers, and distribution systems with better supply chain security tools and best practices.

While I have not read this, CNCF released the Cloud Native Security Whitepaper v2 this week.

In open source conference land we saw in-person events including Percona Live 2022 and KubeCon + CloudNativeCon Europe 2022. Which I was there!

In unrelated tech news, I have cut the cord following ongoing poor customer service with a legacy provider. Welcome to YouTube TV. I am automatically impressed with more features and 1/3 of the price.
Also, Derek Muller has a new video out. Check out my favorite YouTube channel Veritasium.

I’ll leave this blog with a few images reflecting the week.

handcalcs
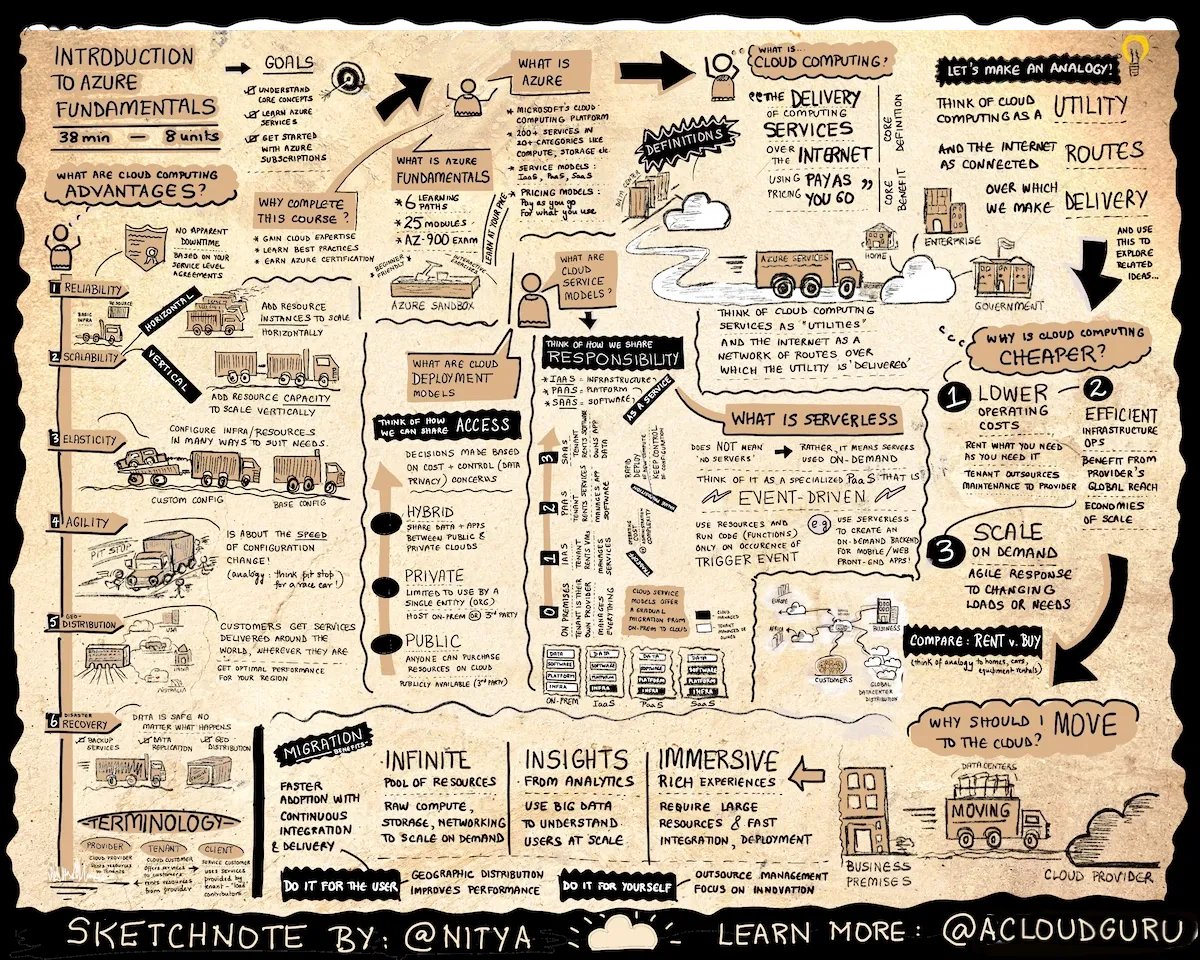
Azure Cloud Infographic
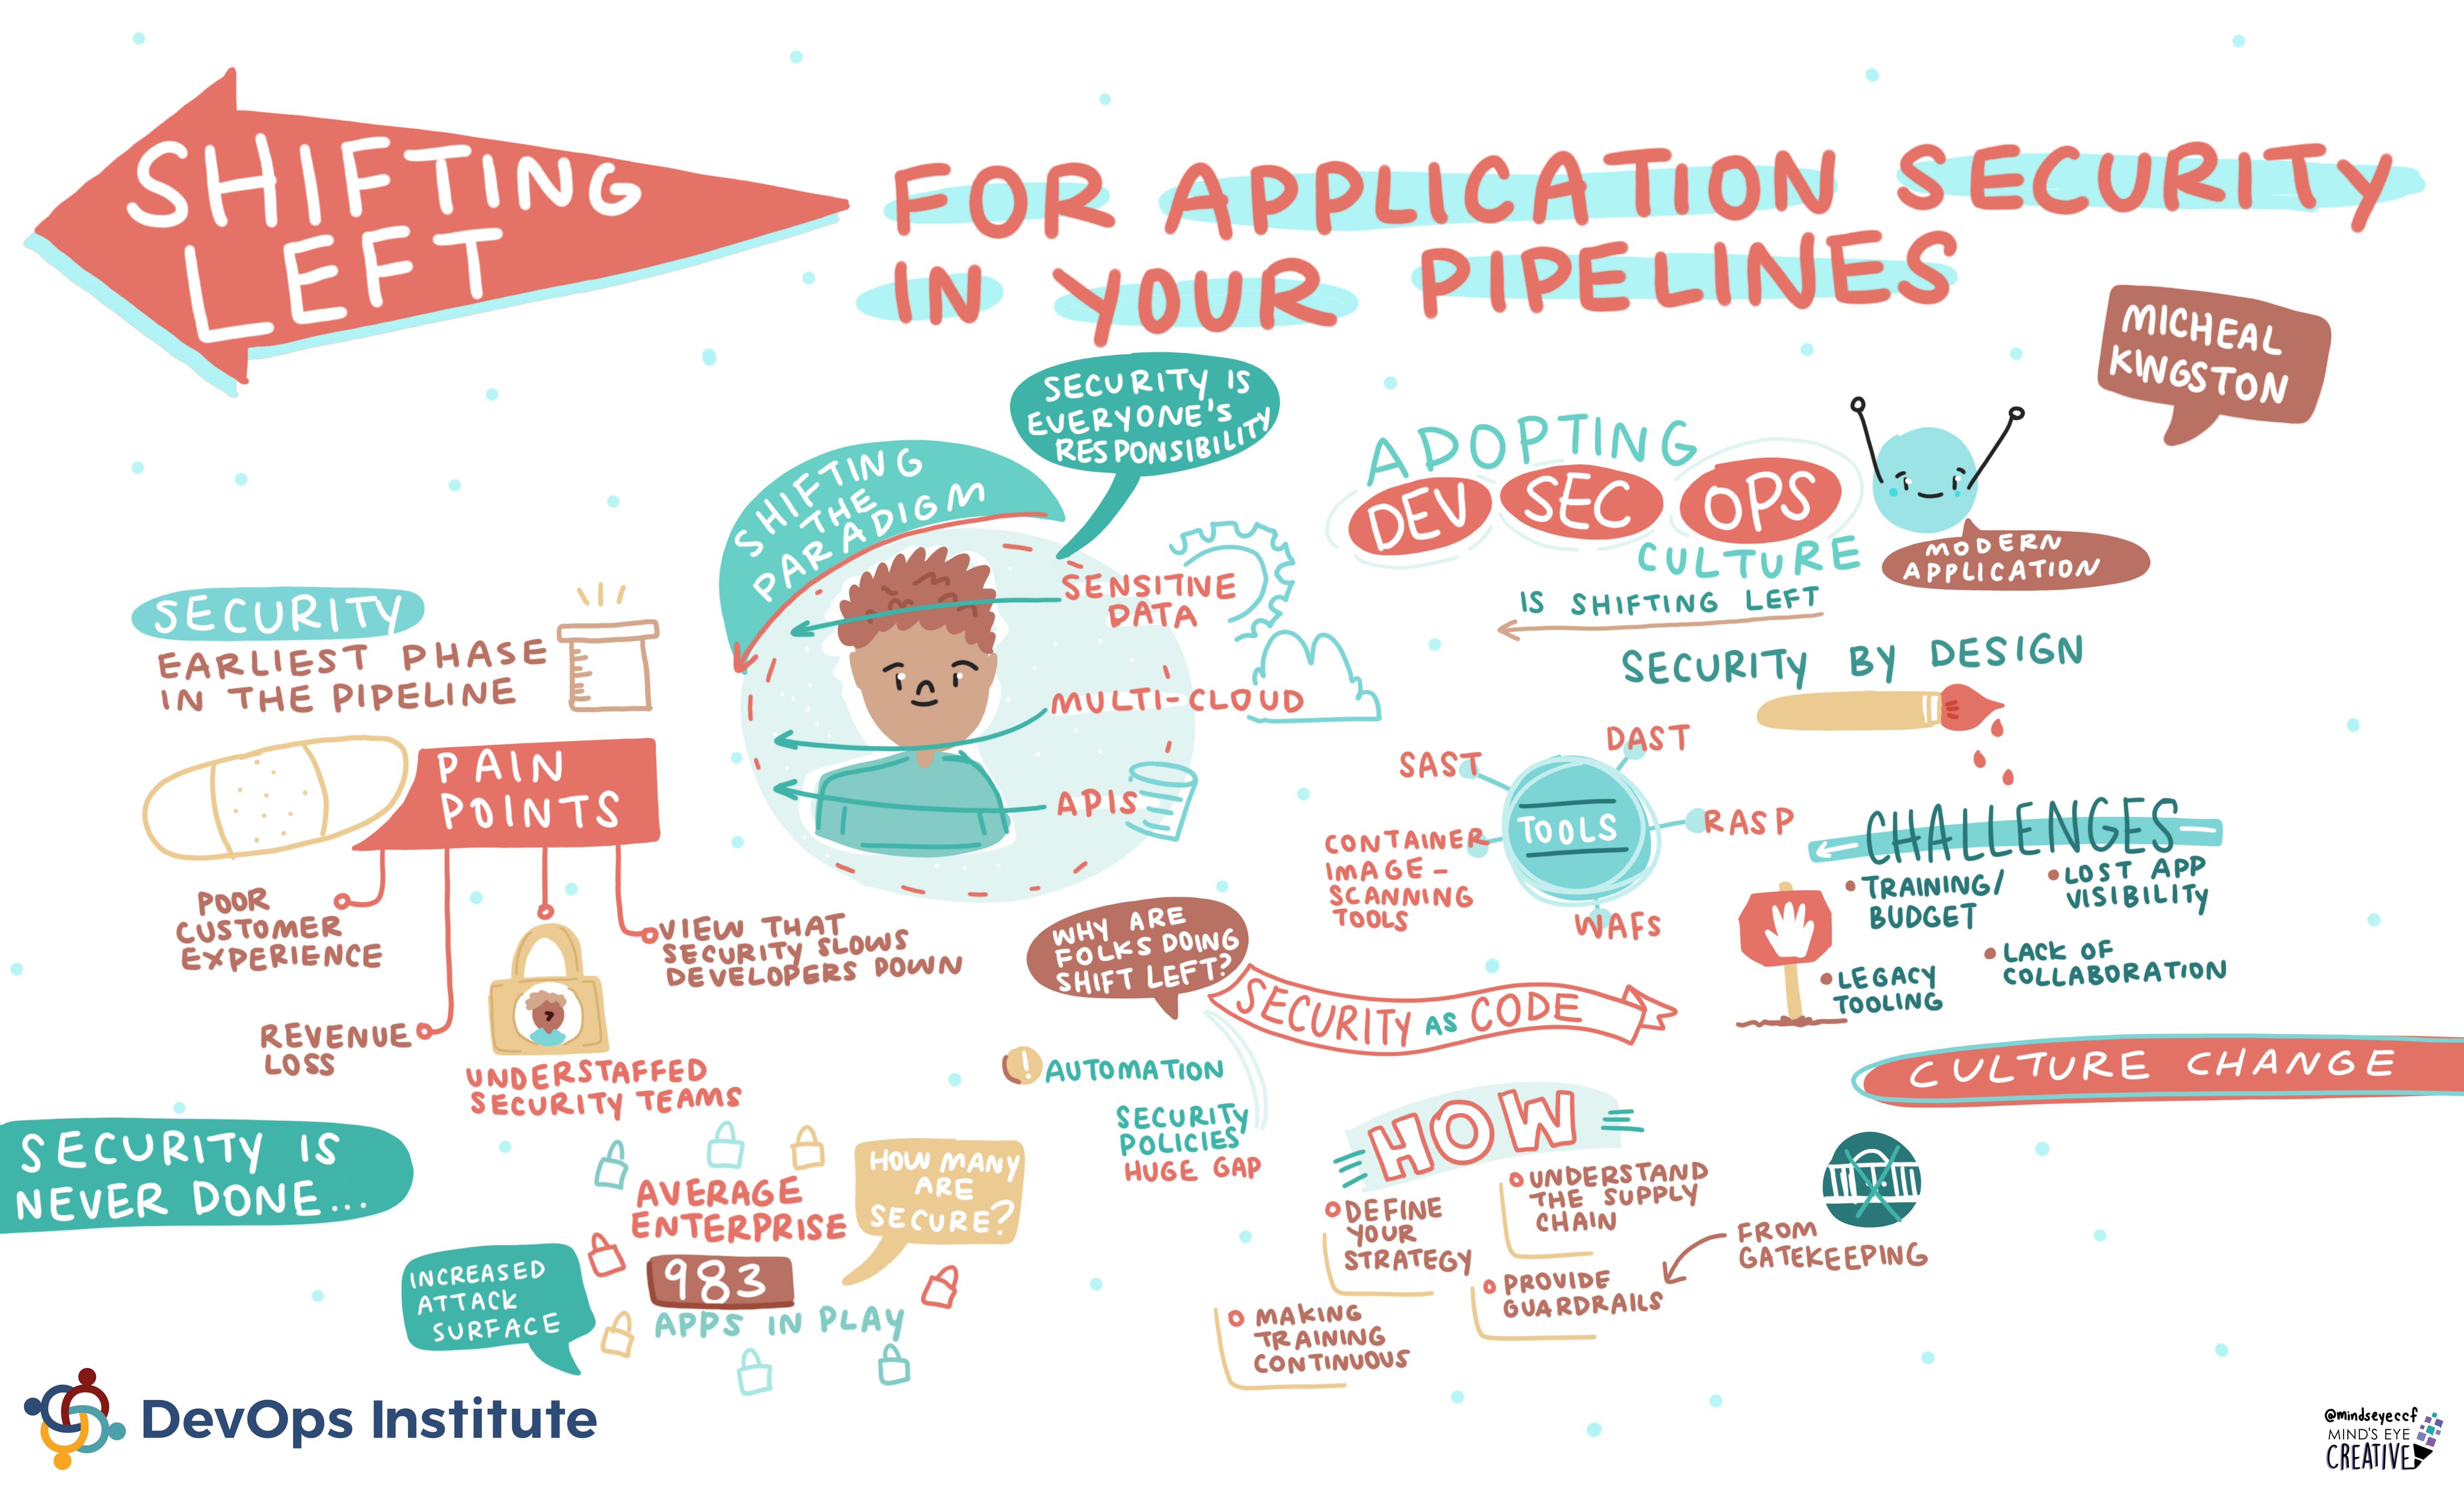
For Application Security in your Pipelines
Shark Tracking

Weekly musings – May 13 2022

As I reflect on this week of my technology journey with the conversations I had, what I learned, and what I wanted to do and write about, I decided what better way to work on multiple blog posts than write about what I’d like to write about.

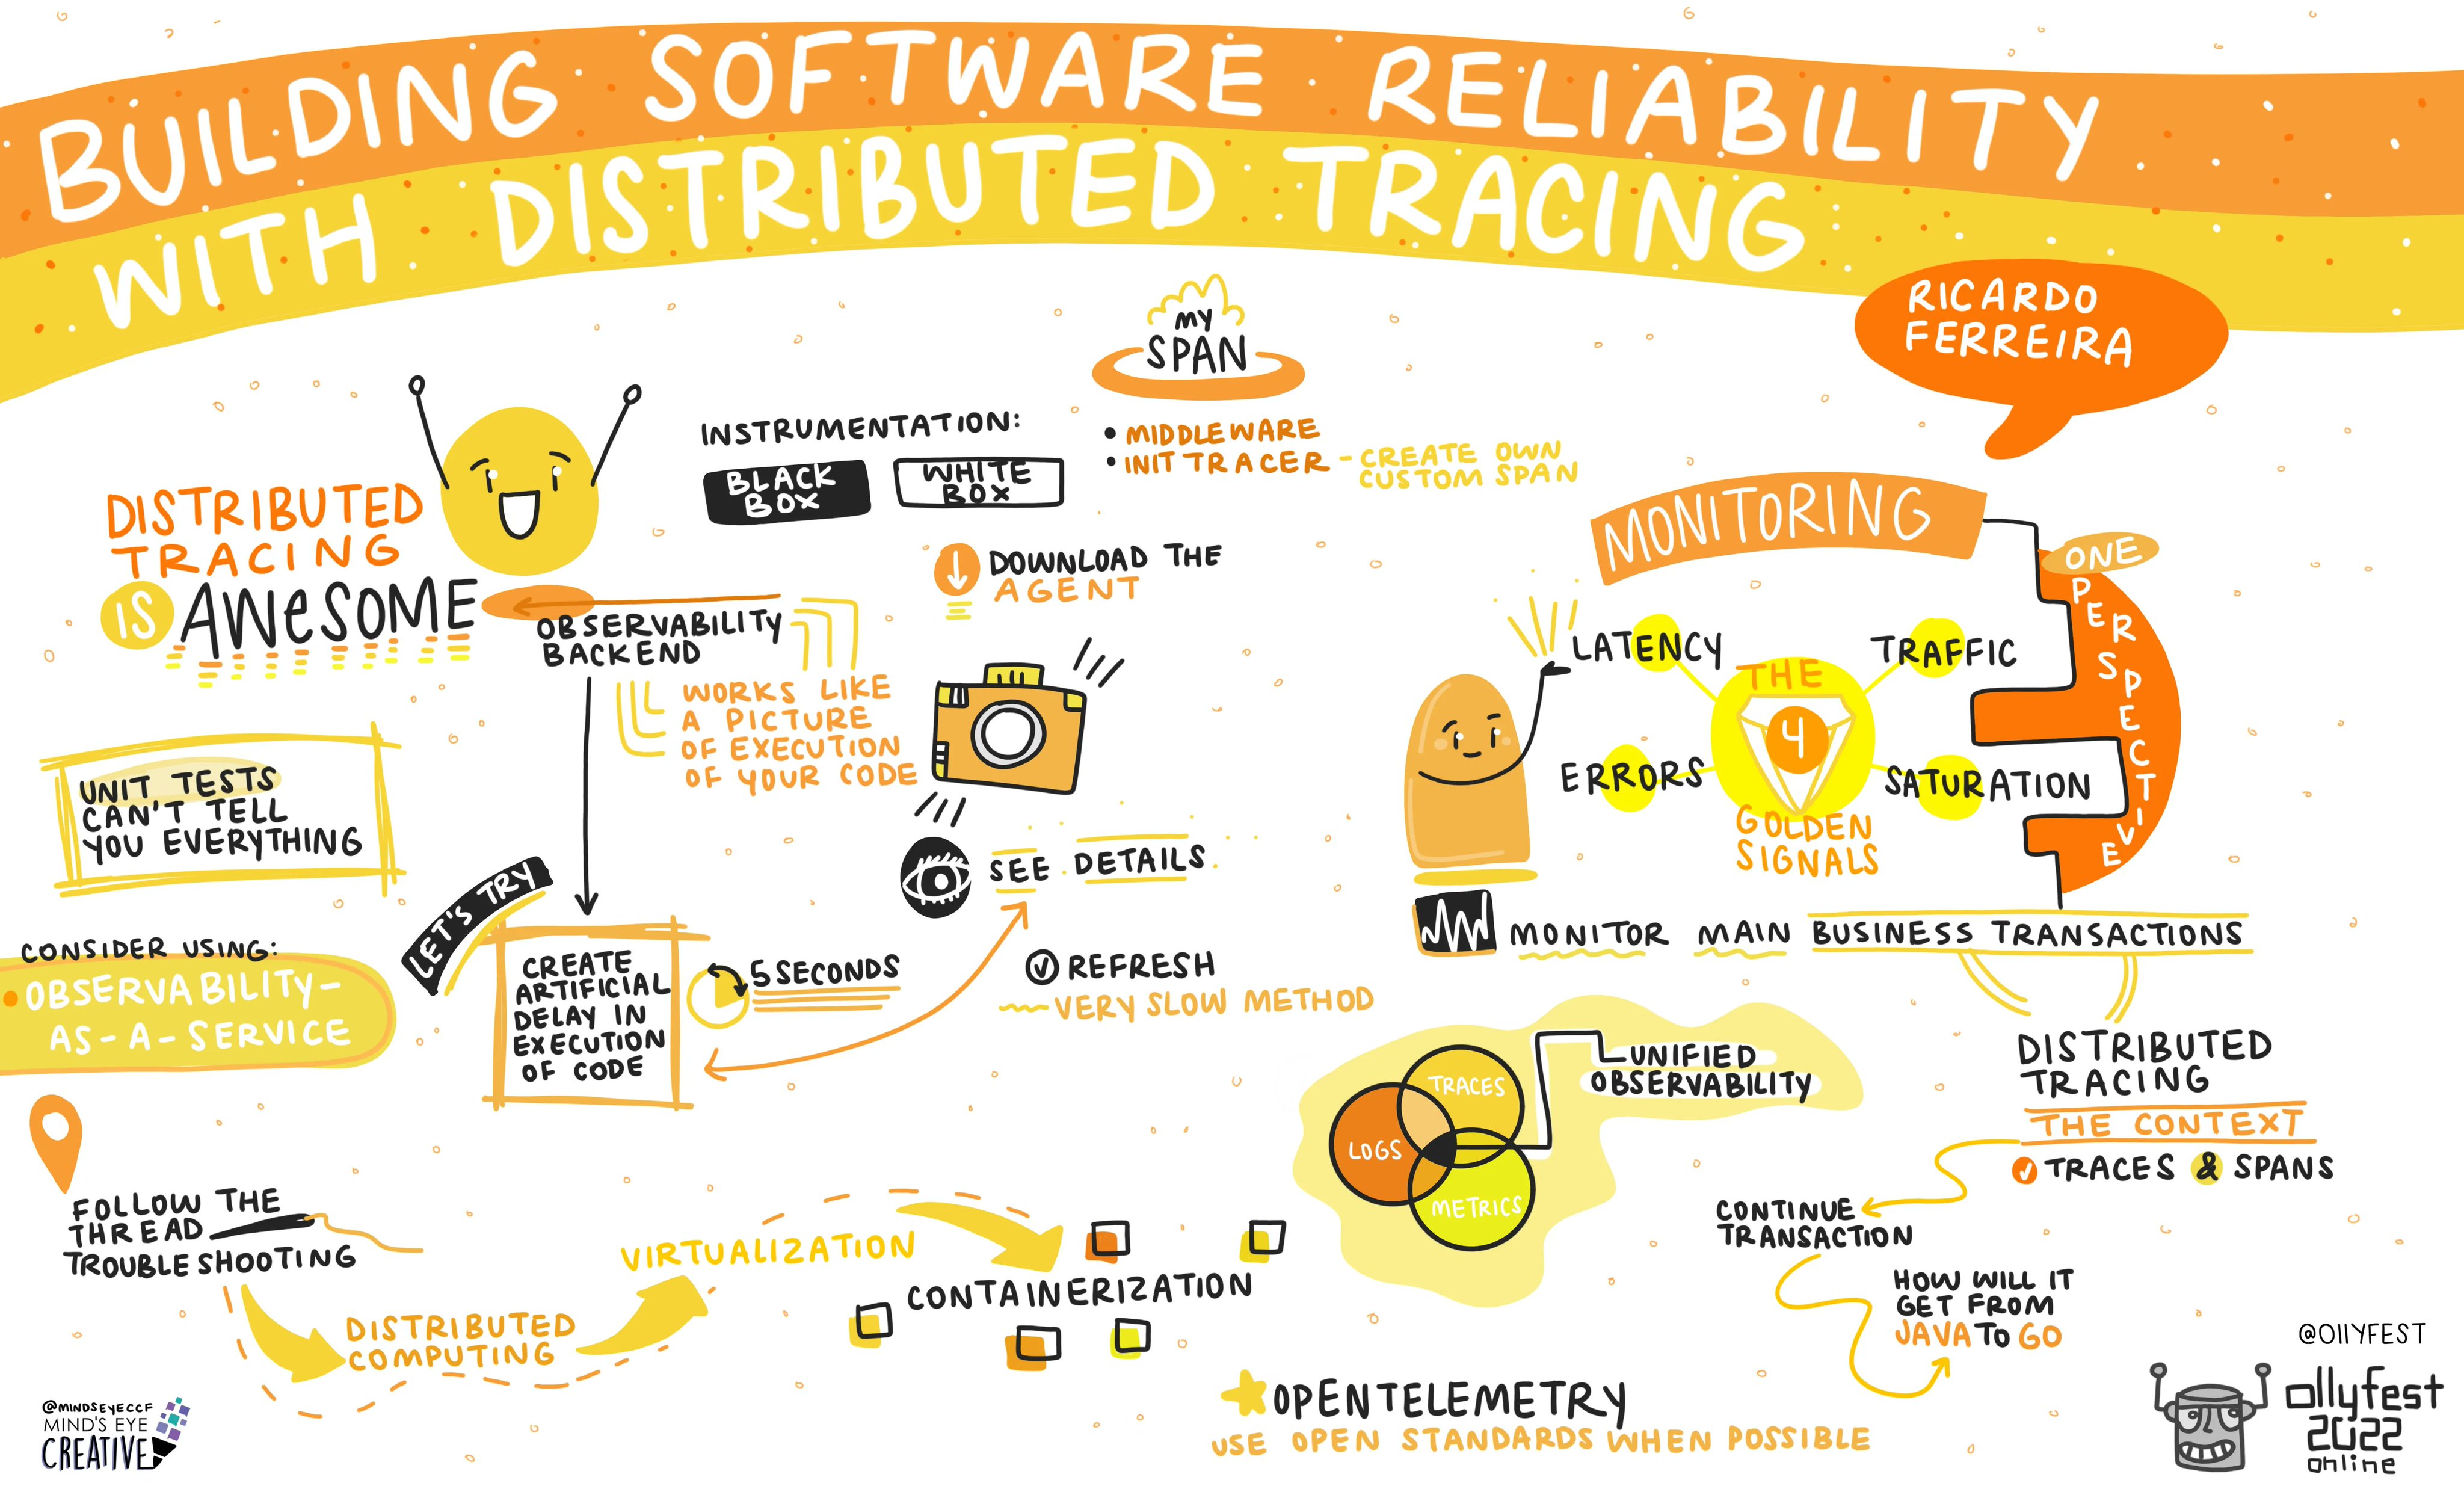
The 2022 observability conference https://o11yfest.org/ is a wrap. For those that are interested in OpenTelemetry this event had plenty of great content with videos with transcripts will become available. Thanks Paul Bruce for your organizing work. While I could only attend some sessions “Building Software Reliability with Distributed Tracing” by Ricardo Ferreira and “Bad Observability” by Stephen Townshend are definitely on my rewatch list. I heard about new things such as keptn – Cloud-native application life-cycle orchestration, and cloudevents – A specification for describing event data in a common way.

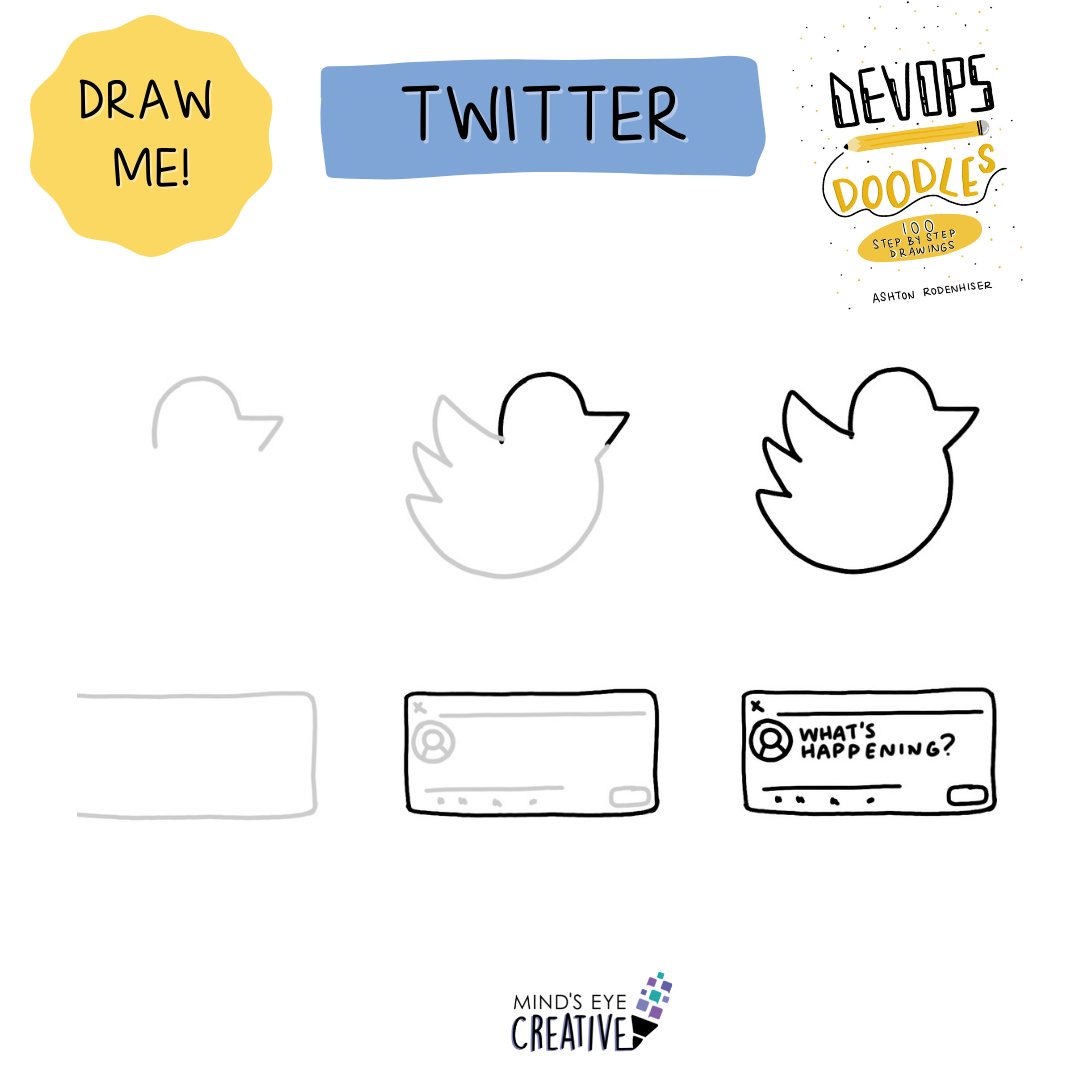
A big shot out to Ashton Rodenhiser of Mind’s Eye Creative, who did these amazing animated canvasas during the presentations, I’ve included one at the bottom of this post.

I have never been that into podcasts. I guess I have always been more of a reader than a listener, but this week while having to do some driving, I dove into listing and realized again why I like to read more. Several times I wish I could stop and take notes however lucky for me I was able to see that Thoughworks Technology Podcasts have online transcripts. Coding lessons from the pandemic, The big five tech trends for 2022 and Following an unusual career path: from dev to CEO were all valuable listening. The single best snippet was on rethinking estimation or “no estimate techniques”. I hope I can discuss and implement myself, the “is basically just three things. It’s just right, it’s too big, or it’s insane”.

I took an intro into Web 3.0 with this F5 webinar What is Web3 and How to Build a Dapp?. Yep, I still don’t get Web 3.0 fully, but I can now launch my own blockchain solution with Scaffold-ETH, write Solidity by Example and Learn how to build on Ethereum; the superpowers and the gotchas should I want to in the future.

While I have my favorite YouTube channels that intersect topics including Math, Physics, Engineering, Technology, Facts and Figures, and woodworking (such as Veritasium (11.9M), CGP Grey (5.35M), DIYMontreal (151K) and 3×3 Custom (620K), as part of having random conversations in the social networking of https://o11yfest.org/ I’ve added two new ones to my list of never having enough time. Fireship (1.31M), and TechLinked (1.73M).

So what did I learn on YouTube this week in addition to you can make a video of a topic in 100 seconds. VS Code Top-Ten Pro Tips. I know Microsoft’s Visual Studio Code is more popular, I see it in presentations, but I never knew it has become the goto integrated platform. While I default to the good old CLI for vi, git and the like, and Atom, this video highlighted I need to use VS Code. We all know computer and math gives undesired results Why do computers suck at math? was fun to watch. And I’ve ordered the plans and getting supplies to make this 6-in-1 Trim Router Jig.

I’ll leave this blog with a few images reflecting the week.

Building Software Reliability with distributed Tracing
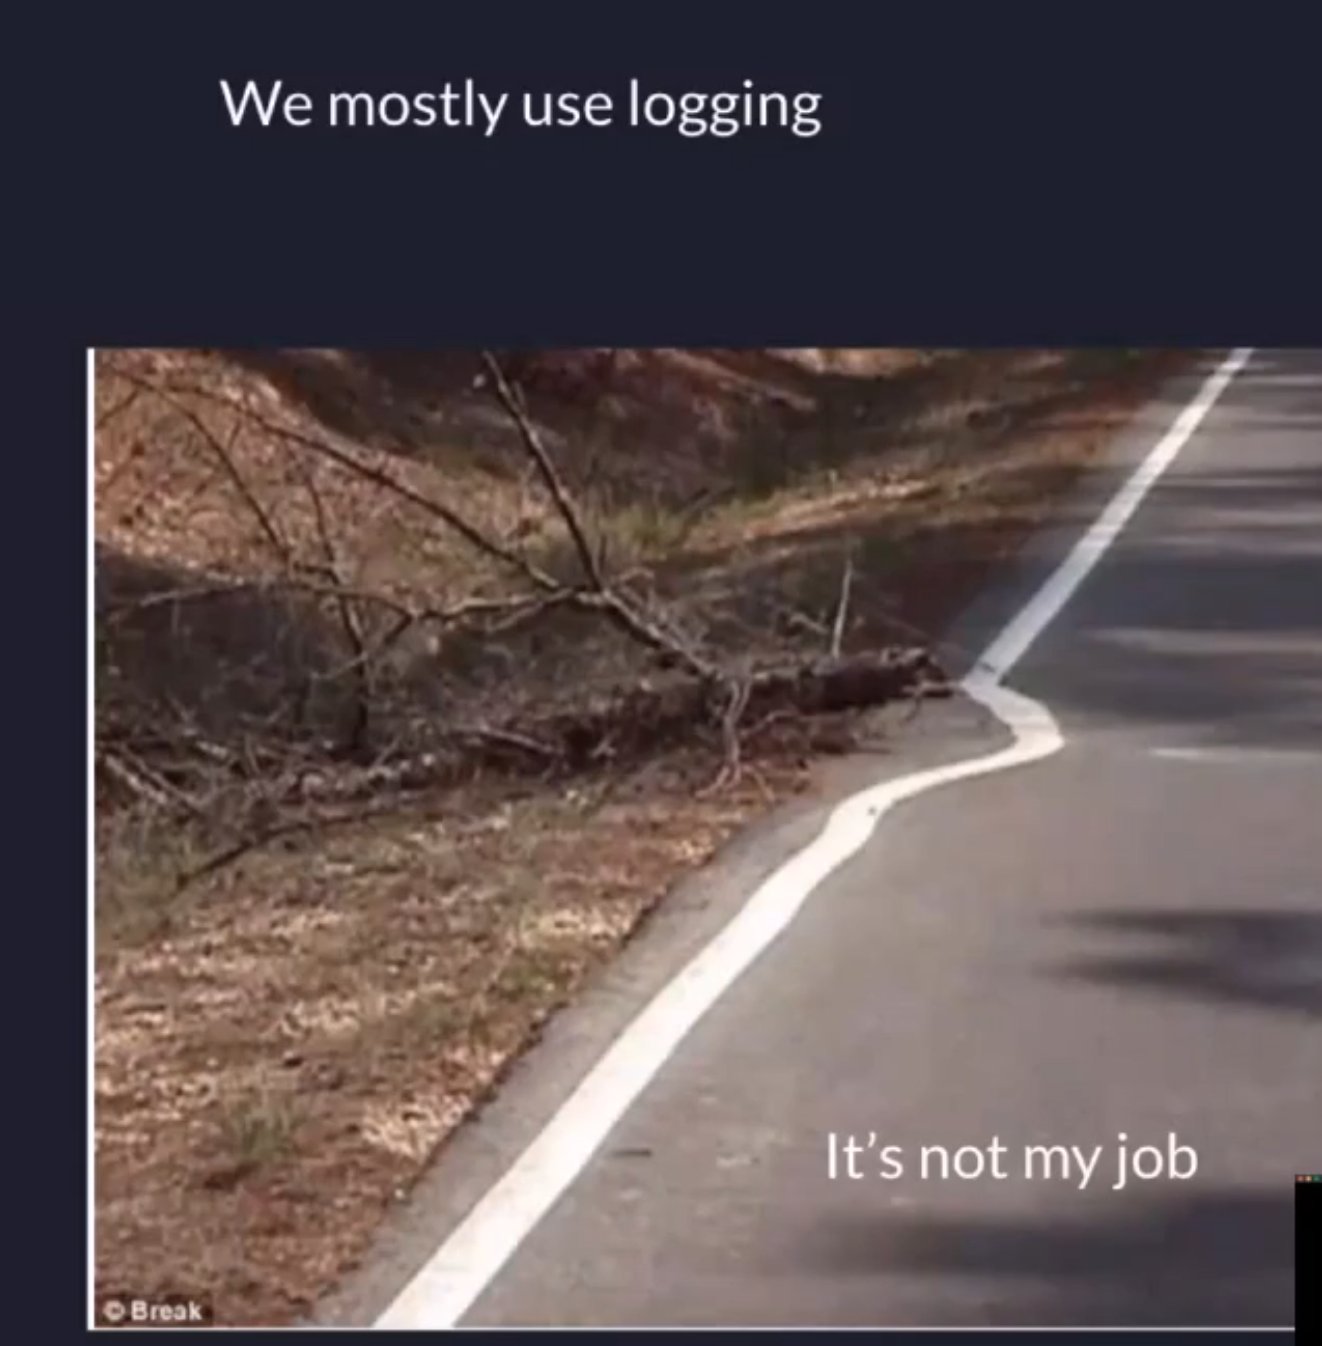
It's not my job
Test Data and Training Data
The AI Model they want, The data they give
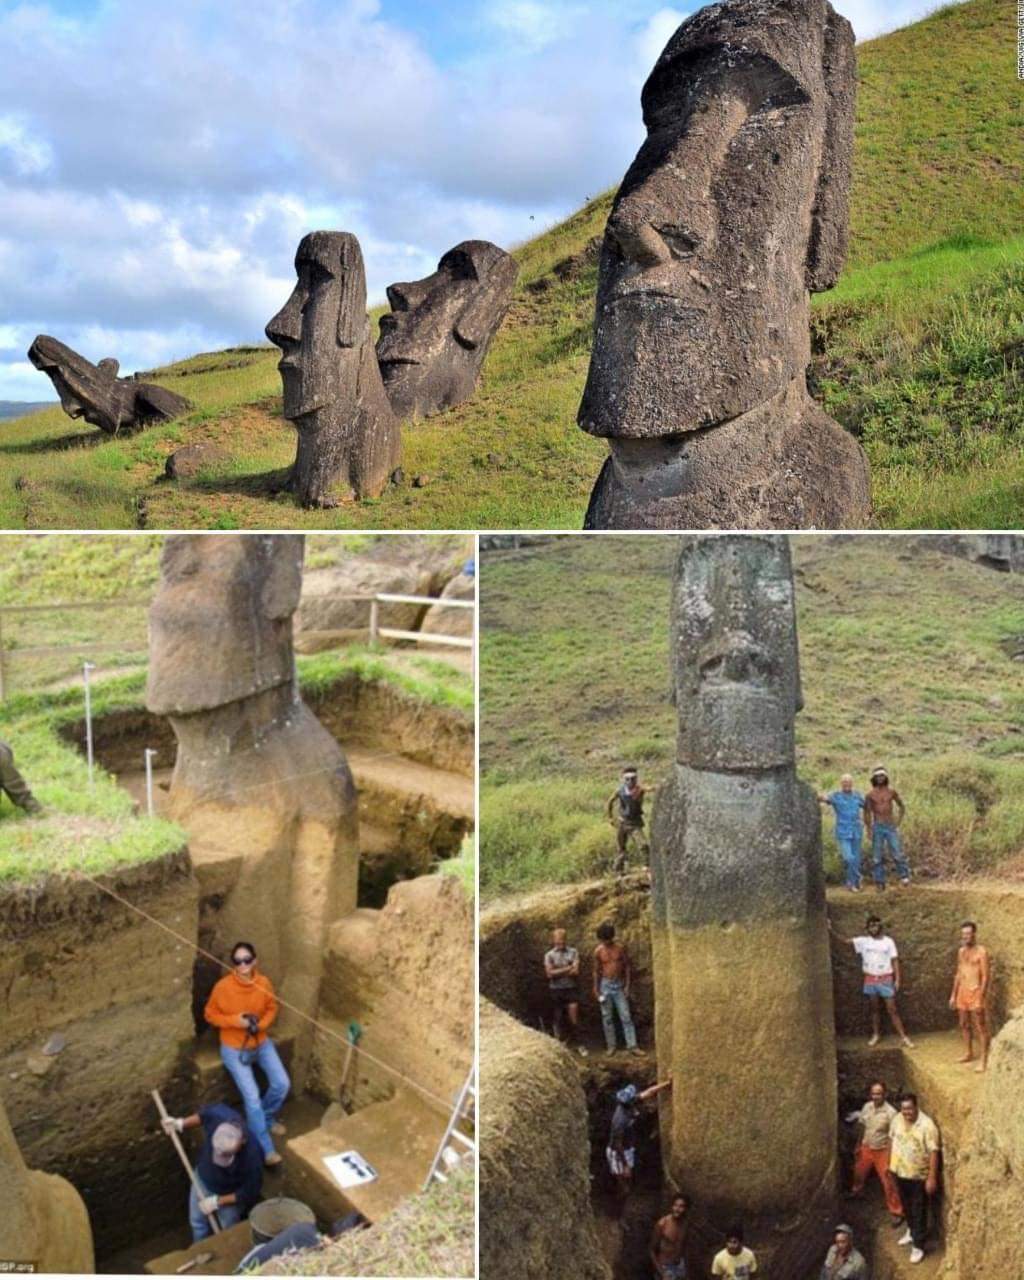
Easter Island - Dig Deeper

SELECT 1

If you have worked with an RDBMS for some time, you will likely have come across the statement SELECT 1.

However, rarely is it correctly explained to engineers what the origin of SELECT 1 is, and why it’s useless and wasteful? A google search is not going to give you the response you would hope, these ranked responses are just as useless as the statement itself.

Bloat

Seeing a SELECT 1 confirms two things. First you are using a generic ORM framework, quote, and second, you have never optimized your SQL traffic patterns.

“Frameworks generally suck.
They CLAIM to improve the speed of development and abstract the need to know SQL.
The REALITY is the undocumented cost to sub-optimal performance, especially with data persistence.”

Connection Pooling

SELECT 1 comes from early implementations of connection pooling.

What is a connection pool? Rather than a new request or call getting a new database connection each time you wanted to return some data, programming languages implemented a cache with a pre-loaded pool of pre-established database connections. The intended goal is to reduce the execution time of an initial expensive operation of getting a new database connection if you were retrieving data from a simple SELECT statement. If intelligent enough (many are not), these pools would include features such as a low watermark, a high watermark, a pruning backoff of idle connections, and an ability to flush all connections.

When your code wanted to access the database to retrieve data, it would first ask the connection pool for an available connection from its pool, mark the connection as in-use and provide that for subsequent consumption.

Here is a simple example of the two queries that would actually be necessary to retrieve one piece of information.

SELECT 1
SELECT email_address, phone, position, active FROM employee where employee_id = ?

Staleness

SELECT 1 was implemented as the most light-weight SQL statement (i.e., minimal parsing, privilege checking, execution) that would validate that your connection was still active and usable. If SELECT 1 failed, i.e. a protocol communication across your network, the connection could be dropped from the connection pool, and a new connection from the pool could be requested. While this may appear harmless, it leads to multiple code in-efficiencies, a topic for a subsequent discussion.

Failed error handling

SELECT 1 was a lazy and flawed means to perform error handling. In reality, every single SQL statement requires adequate error handling, any statement can fail at any time to complete. In the prior example, what happens if the SELECT 1 succeeds but a simple indexed SELECT statement fails? This anti-pattern also generally shows that error handling is inconsistent and highly duplicated rather than at the correct position in the data access path.

By definition, error handling is needed in an abstraction function for all SQL statements, and it needs to handle all types of error handling including the connection no longer valid, connection terminated, timed out, etc.

If you had the right error handling SELECT 1 would then be redundant, and as I stated useless. You simply run the actual SELECT statement and handle any failure accordingly.

High availability

In today’s cloud-first architectures where high availability consists of multiple availability zones and multiple regions where application A can communicate with database B, every unneeded network round-trip in a well-tuned system is wasteful, i.e. it is costing you time to render a result quicker. We all know studies have shown that slow page loads drive users away from your site.

The cost of the cloud

This AWS Latency Monitoring grid by Matt Adorjan really shows you the impact that physics has on your resiliency testing strategy when application A and database B are geographically separated and you just want one piece of information.

Conclusion

The continued appearance of SELECT 1 is a re-enforcement that optimizing for performance is a missing skill for the much larger engineering code-writing workforce that have lost the ability for efficiency. It is also another easy win that becomes an unnecessary battle for Data Architects to ensure your organization provides a better customer experience.