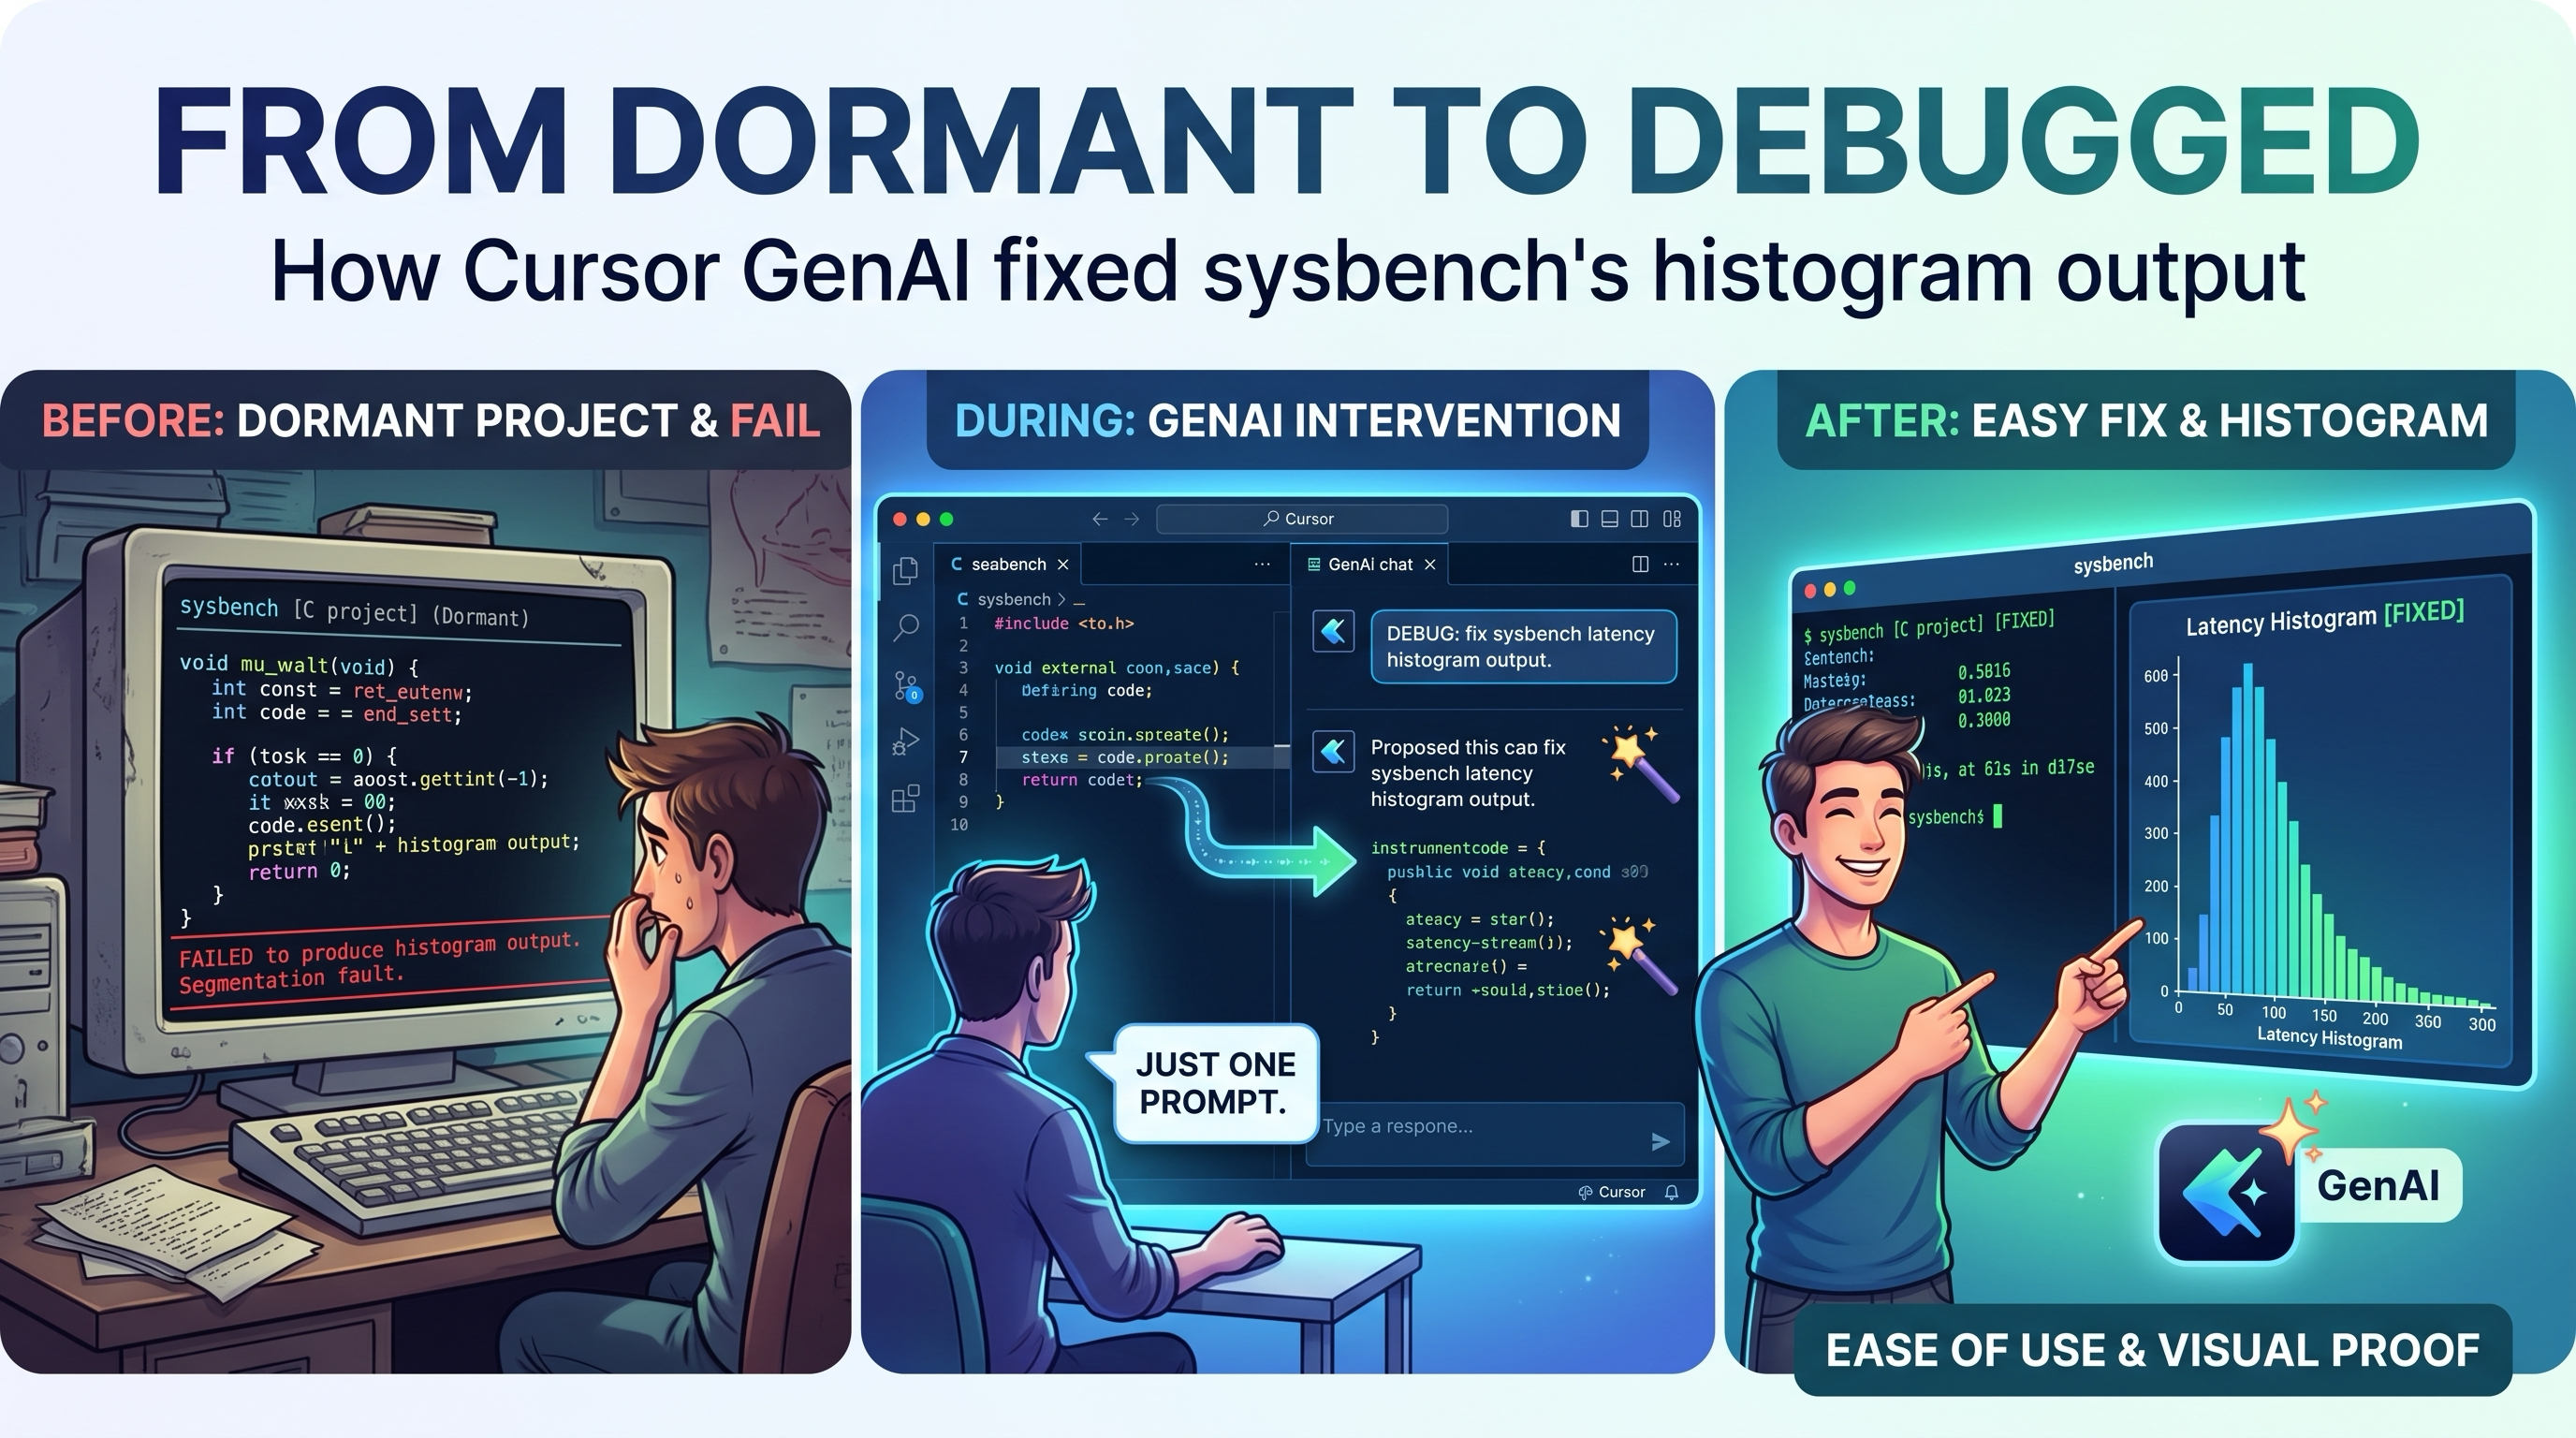
I previously came across an issue in my benchmarking work where I relied on the Latency Histogram section of sysbench output. On Linux it worked fine — I generally ran my workload there, so it never mattered. When I switched to macOS the histogram truncated: everything after the Latency histogram header was missing. It was a bug, but more of a nuisance than a blocker, and with the project no longer actively maintained it did not warrant investigation at the time.
This morning I needed that output on macOS. My Linux servers are in a shipping container somewhere off Hong Kong, and local benchmarking was the path of least resistance. With multiple idle AIs on my equipment, what would have been an afternoon of C debugging became a sub-15-minute task: build a fresh sysbench from source, describe the problem with a reproducible test case (slightly complicated because it requires a MySQL instance and default schema/data), and have the fix applied.
The setup
I used Cursor with Composer 2.5, pointed it at the sysbench source tree, and started with this prompt:
Run this command and see the output produced, and no information after the Latency Histogram section.

sysbench oltp_read_write --db-driver=mysql --mysql-host=127.0.0.1 --mysql-port=8408 --mysql-user=msandbox --mysql-password=msandbox --mysql-ssl=off --report-interval=1 --histogram=1 --threads=4 --table-size=1000 --tables=10 --time=10 run
I quickly got a response — but not a fix. The agent could see the truncated output but did not connect it to a platform-specific defect without more direction. Fair enough. It was Monday morning; my prompting needed work.
The prompt that worked
This works on linux, but fails on Mac, so debug why.
That was enough. With the source code in context, a running MySQL sandbox on port 8408, and a clear platform comparison, Cursor traced the issue, patched the code, and rebuilt. Total elapsed time from opening the project to verified histogram output on macOS: under 15 minutes (it was more like 5 minutes).
Finalizing my work
add the /tmp/histogram_test.lua to tests, create a branch and commit fix.
push and create PR, be sure to add all the information from this thread as to explain the reason why this was broken on MacOS
The result is PR#1
, a separate fork of sysbench that includes several improvements.
What this means
This is not a story about AI replacing software engineering. I knew exactly what the broken output looked like — I had seen it for years. I knew where the code lived. I had a reproducible command and a database ready to run it. What I did not have was time to review a C codebase for a histogram formatting bug on a platform I rarely used.
The first prompt asked the agent to observe. The second asked it to compare and explain. That distinction mattered. “Run this and see” produces analysis. “Works on Linux, fails on Mac — debug why” produces a hypothesis, a diff, and a build.
For unmaintained open source tools you depend on — sysbench in my benchmarking suite — this changes the economics of minor bugs. Not every nuisance deserves a weekend. Some just need a Monday morning, a sandbox, and a second prompt that states the obvious platform delta you already knew but never wrote down.
Fixing old software bugs without thinking is overstating it. I was thinking — about the symptom, the test case, and what to ask next. I just was not doing the part that used to require opening src/ and reading print statements on a platform I rarely use.
More on sysbench capabilities and how I use histogram output in Sysbench Under the Covers and Creating a More Realistic Benchmark .
A Failing Test Visualization
$ sysbench --histogram /tmp/histogram_test.lua --events=2 --threads=2 run
sysbench 1.0.20 (using system LuaJIT 2.1.1753364724)

Running the test with following options:
Number of threads: 2
Initializing random number generator from current time


Initializing worker threads...

Threads started!

Latency histogram (values are in milliseconds)


General statistics:
    total time:                          2.0061s
    total number of events:              2

Latency (ms):
         min:                                 1004.54
         avg:                                 1504.81
         max:                                 2005.08
         95th percentile:                        0.00
         sum:                                 3009.63

Threads fairness:
    events (avg/stddev):           1.0000/0.00
    execution time (avg/stddev):   1.5048/0.50
A Successful Test Outcome
$ /Users/rbradfor/git/sysbench/src/sysbench --histogram /tmp/histogram_test.lua --events=2 --threads=2 run
sysbench 1.1.1-94740b0 (using system LuaJIT 2.1.1767980792)

Running the test with following options:
Number of threads: 2
Initializing random number generator from current time


Initializing worker threads...

Threads started!

Latency histogram (values are in milliseconds)
       value  ------------- distribution ------------- count
    1013.597 |**************************************** 1
    2009.233 |**************************************** 1


Throughput:
    events/s (eps):                      0.9971
    time elapsed:                        2.0058s
    total number of events:              2

Latency (ms):
         min:                                1005.124
         avg:                                1505.113
         max:                                2005.102
         95th percentile:                    2009.233
         sum:                                3010.226

Threads fairness:
    events (avg/stddev):           1.0000/0.00
    execution time (avg/stddev):   1.5051/0.50
The AI Optimization
I had never taken the time to produce a working test without the MySQL stack, simply because that was what I used. AI did not need the additional stack, and wrote a clear test case I would not have produced myself.
$ more /tmp/histogram_test.lua
local ffi = require("ffi")
ffi.cdef[[
  int usleep(unsigned int);
]]
function event()
  if (sysbench.tid == 0) then
    ffi.C.usleep(1000000)
  else
    ffi.C.usleep(2000000)
  end
end