In a CPU-bound database workload, regardless of price, would you scale-up or scale-new?
What if price was the driving factor, would you scale-up or scale-new?
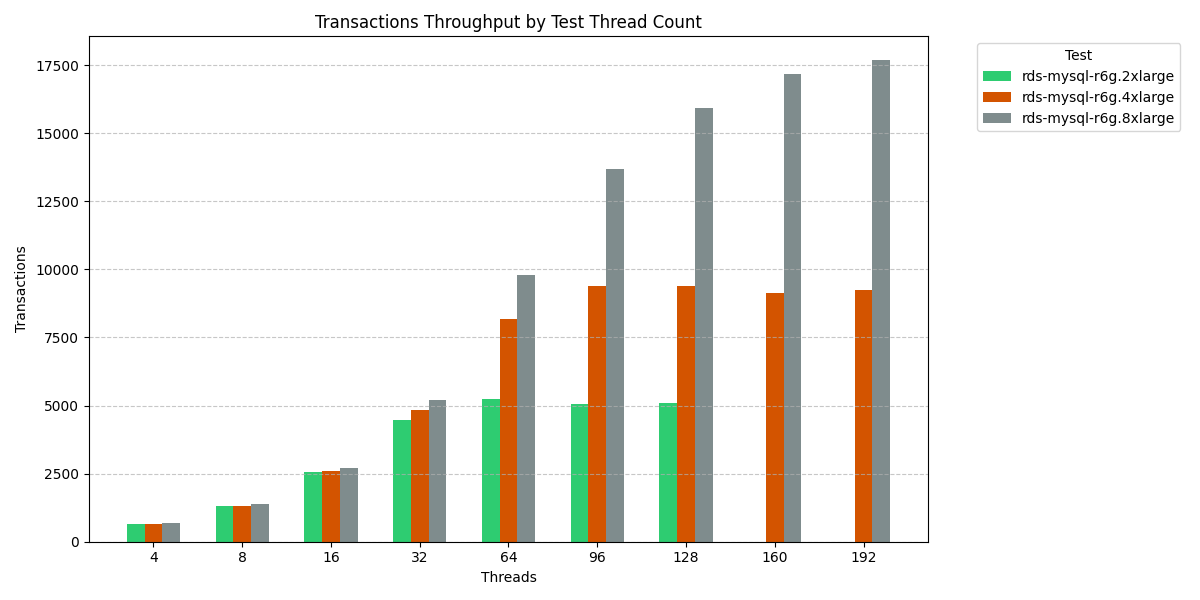
I am using as a baseline the first available AWS Graviton2 processor for RDS (r6g). As part of my benchmarking using the IMDb read-only workload , I have performed tests both in doubling vCPUs , i.e. 2x, 4x, 8x, and also comparing newer Graviton processors , i.e. r6g, r7g, r8g. This analysis does not factor additional differences in RAM, network bandwidth or disk throughput.
Granted this is only one test comparing the baseline (r6g.2x), however the scale-new strategy (i.e. r8g.2x) yields the same throughput as scale-up strategy (i.e. r6g.4x). The scale-new is 11% more expensive, compared with 100% for scale-up?
Would latency have an impact on your decision?
With comparable threads workload there is negligible difference in average latency.
r6g.4xlarge (red bar)
| Threads | Average Latency | 95th Percentile | Throughput |
|---|---|---|---|
| 96 | 10.206 | 17.633 | 9404.62 |
| 128 | 13.642 | 27.659 | 9380.89 |
r8g.2xlarge (purple bar)
| Threads | Average Latency | 95th Percentile | Throughput |
|---|---|---|---|
| 96 | 10.07 | 19.29 | 9531.00 |
| 128 | 13.64 | 27.17 | 9383.90 |
It pays to have an adequate testing infrastructure in your organization to evaluate your workloads and new processors and/or new features offered by the Cloud Service Providers.
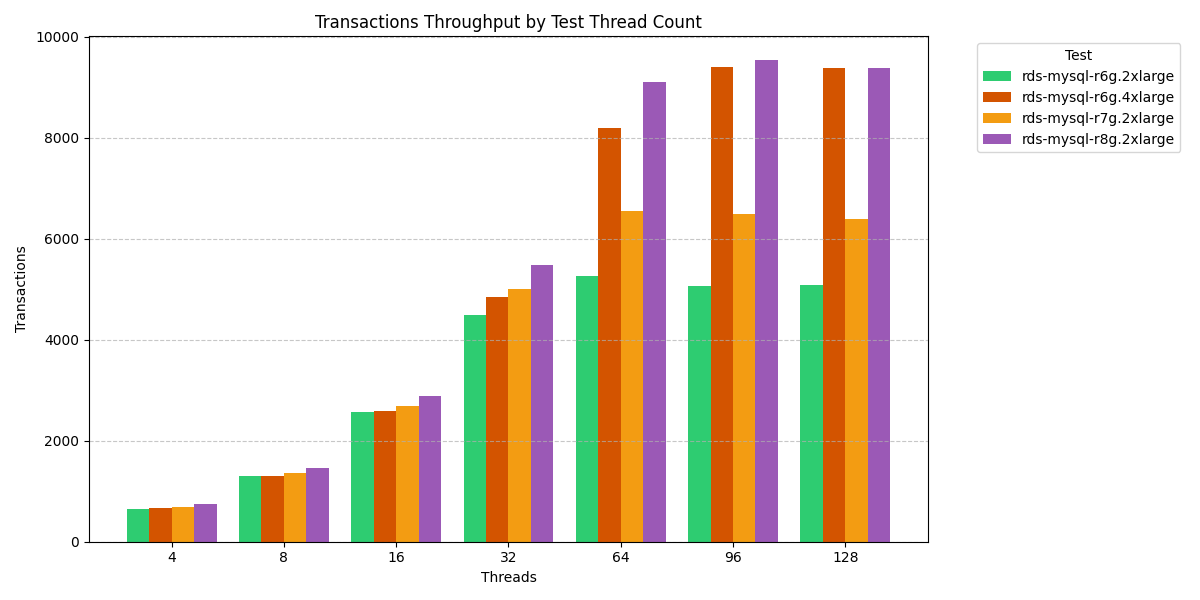
What are the marketing claims for performance improvement?
- In Apr 2023 (~ 2 years ago), AWS announced the r7g processor family for RDS , and a claimed improvement of 30% over Graviton-2.
- In Nov 2024 (~ 6 months ago), AWS announced the r8g processor family for RDS , and a claimed 40% improvement over Graviton-3.
If these marketing claims were accurate and supported with provided benchmarks, Graviton3 = 1.3 (30% faster than Graviton2) and Graviton4 = 1.3 × 1.4 = 1.82 (i.e., r8g is 82% faster than r6g).
How do these marketing claims stand up?
How accurate are these statements with my initial read-only benchmark?
r6g.2xlarge
| Threads | Average Latency | 95th Percentile | Throughput | Ratio | Expected Throughput | r8g.2xlarge Throughput |
|---|---|---|---|---|---|---|
| 96 | 18.95 | 33.72 | 5065.97 | x 1.82 | 9219 | 9531 |
| 128 | 25.13 | 44.17 | 5092.16 | x 1.82 | 9267 | 9383 |
r8g.2xlarge
| Threads | Average Latency | 95th Percentile | Throughput |
|---|---|---|---|
| 96 | 10.07 | 19.29 | 9531.00 |
| 128 | 13.64 | 27.17 | 9383.90 |
Does r8g outperform r6g by 1.82x?
Maybe!
The r8g processor with 8 vCPUs in this single benchmark exceeds the 1.82x performance improvement of the r6g processor with vCPUs when comparing equivalent threads (emulating an application workload).
As I mentioned earlier, you should always test your unique workload and situation adequately to make informed decisions for your infrastructure. Different workloads and different resource-bound situations create a complex matrix of . My tests also included higher thread concurrency than shown here.
Other Impacts
The r6g family were choosen as there is both r7g and r8g to compare. There are no Intel equilivant instance types available for RDS across 3 families.
There are a few reasons why scale-new would not be option. These include:
- Size Flexible Reserved Instance Reservations (these are locked to family, product, region) for a 1 year or 3 year committment.
- Only a subset of regions support newer instance types
.
r8g&m8gwere only just expanded beyond an initial 3 regions.
As I have mentioned, there is no reason to not upgrade from r7g to r8g if using on-demand instances as these are currently the same price.
Test Results
2x comparison across families
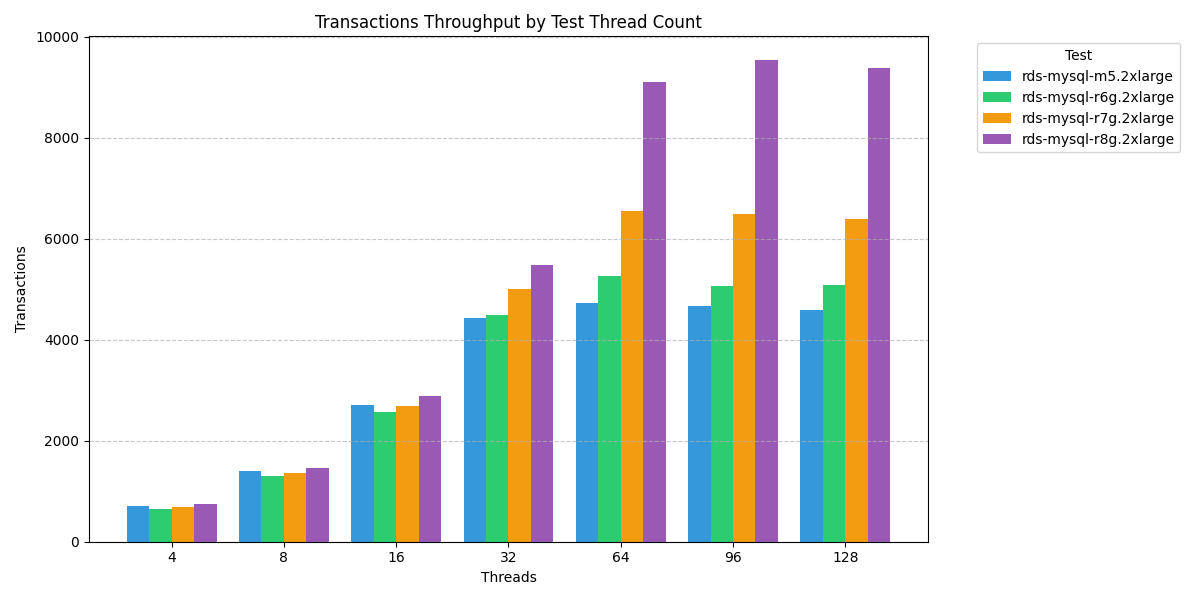
r6g 2x,4x,8x CPU Tests
