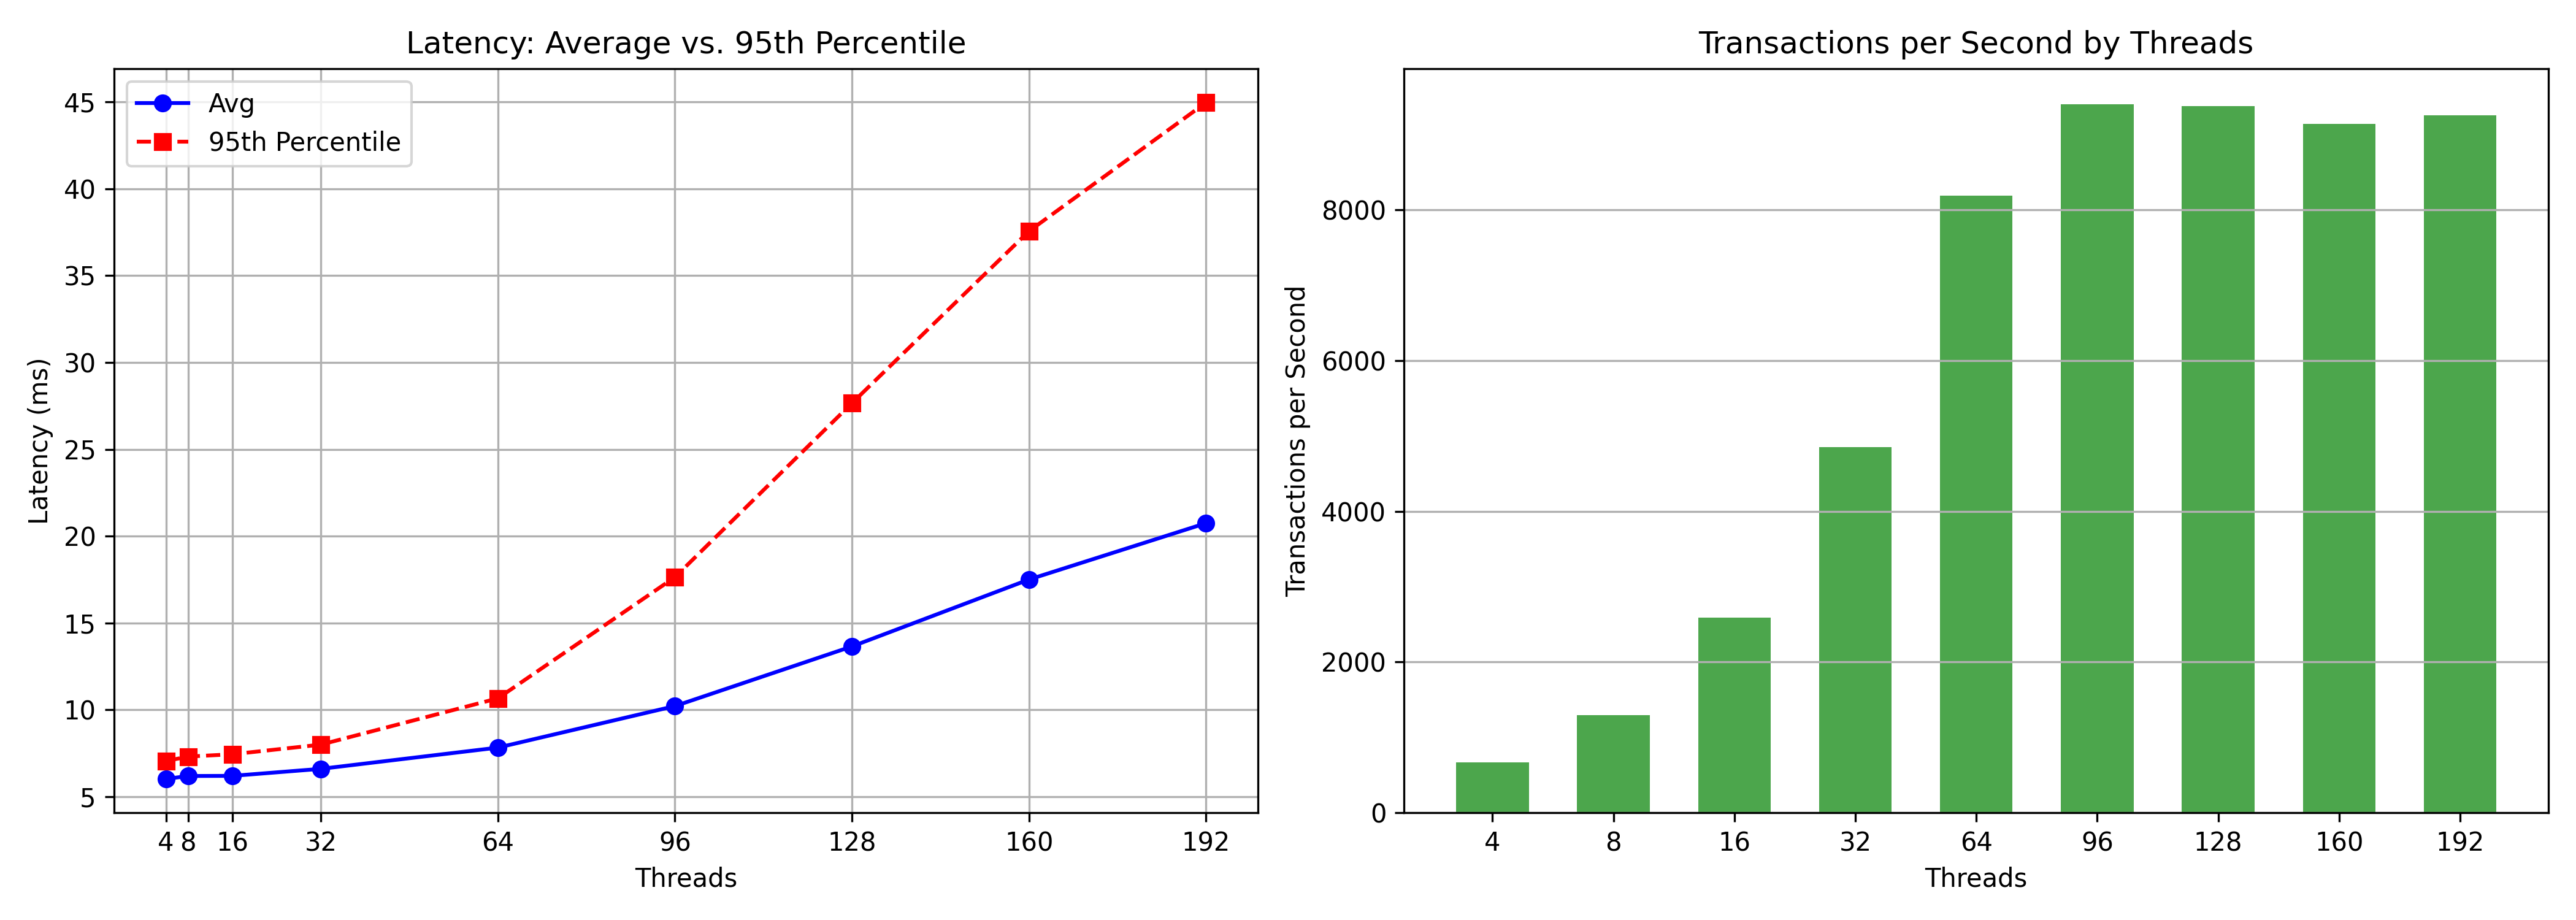
Higher throughput does not imply improved performance. This is a common problem when the need for an application to support more users, you provide higher concurrency and that appears to show the capability to support higher throughput. If we were to look at the Cloudwatch metrics for a RDS database, we can track DB Connections and DB Selects during a benchmark. There is no easy way to track latency. We see that with higher concurrent connections (red bar), we obtain higher select throughput (blue bar). This benchmark tests 2,4,8,16,32,64,96,128,160,192 threads.
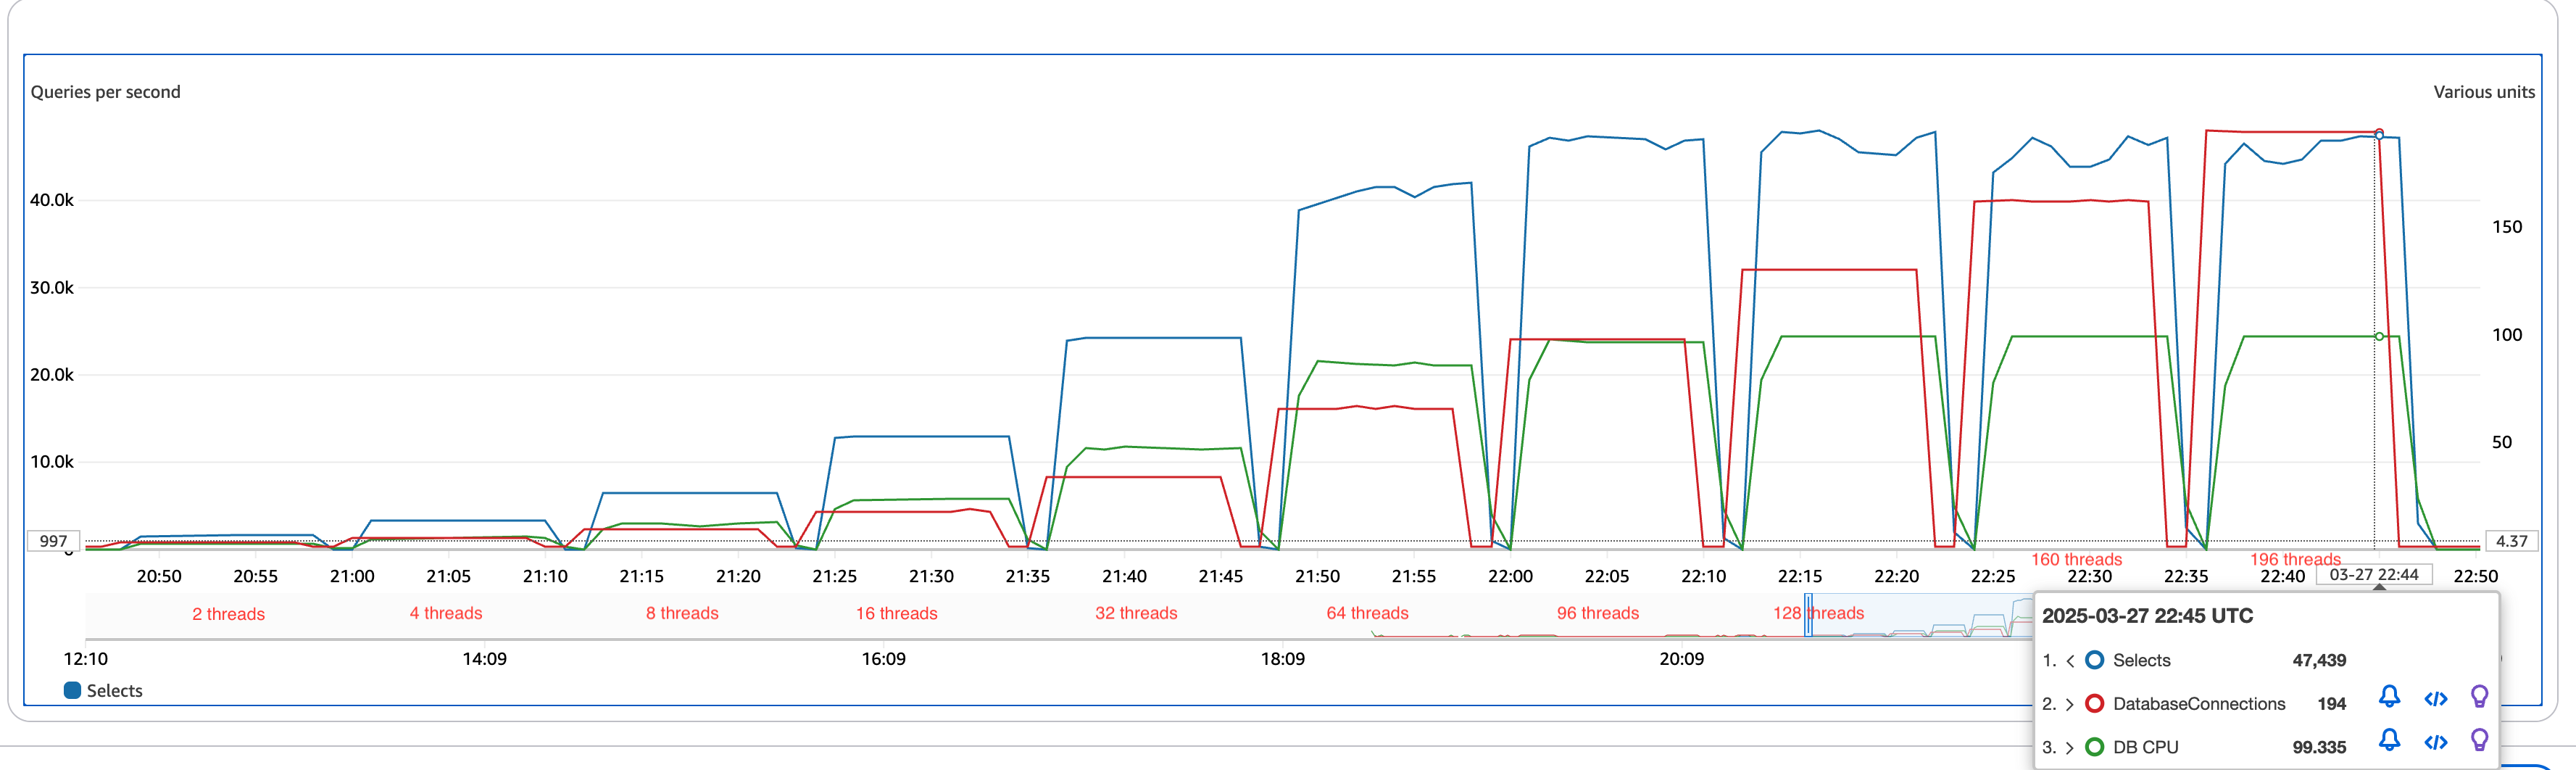
We get to a point where throughput maxes out. In this example due to a CPU bottleneck (green bar) as this reaches 100% (96 threads). However systems can hit other resource exhaustion including Disk IOPS or network throughput. The problem is, while more threads provide the same throughput, a more serious effect happens.
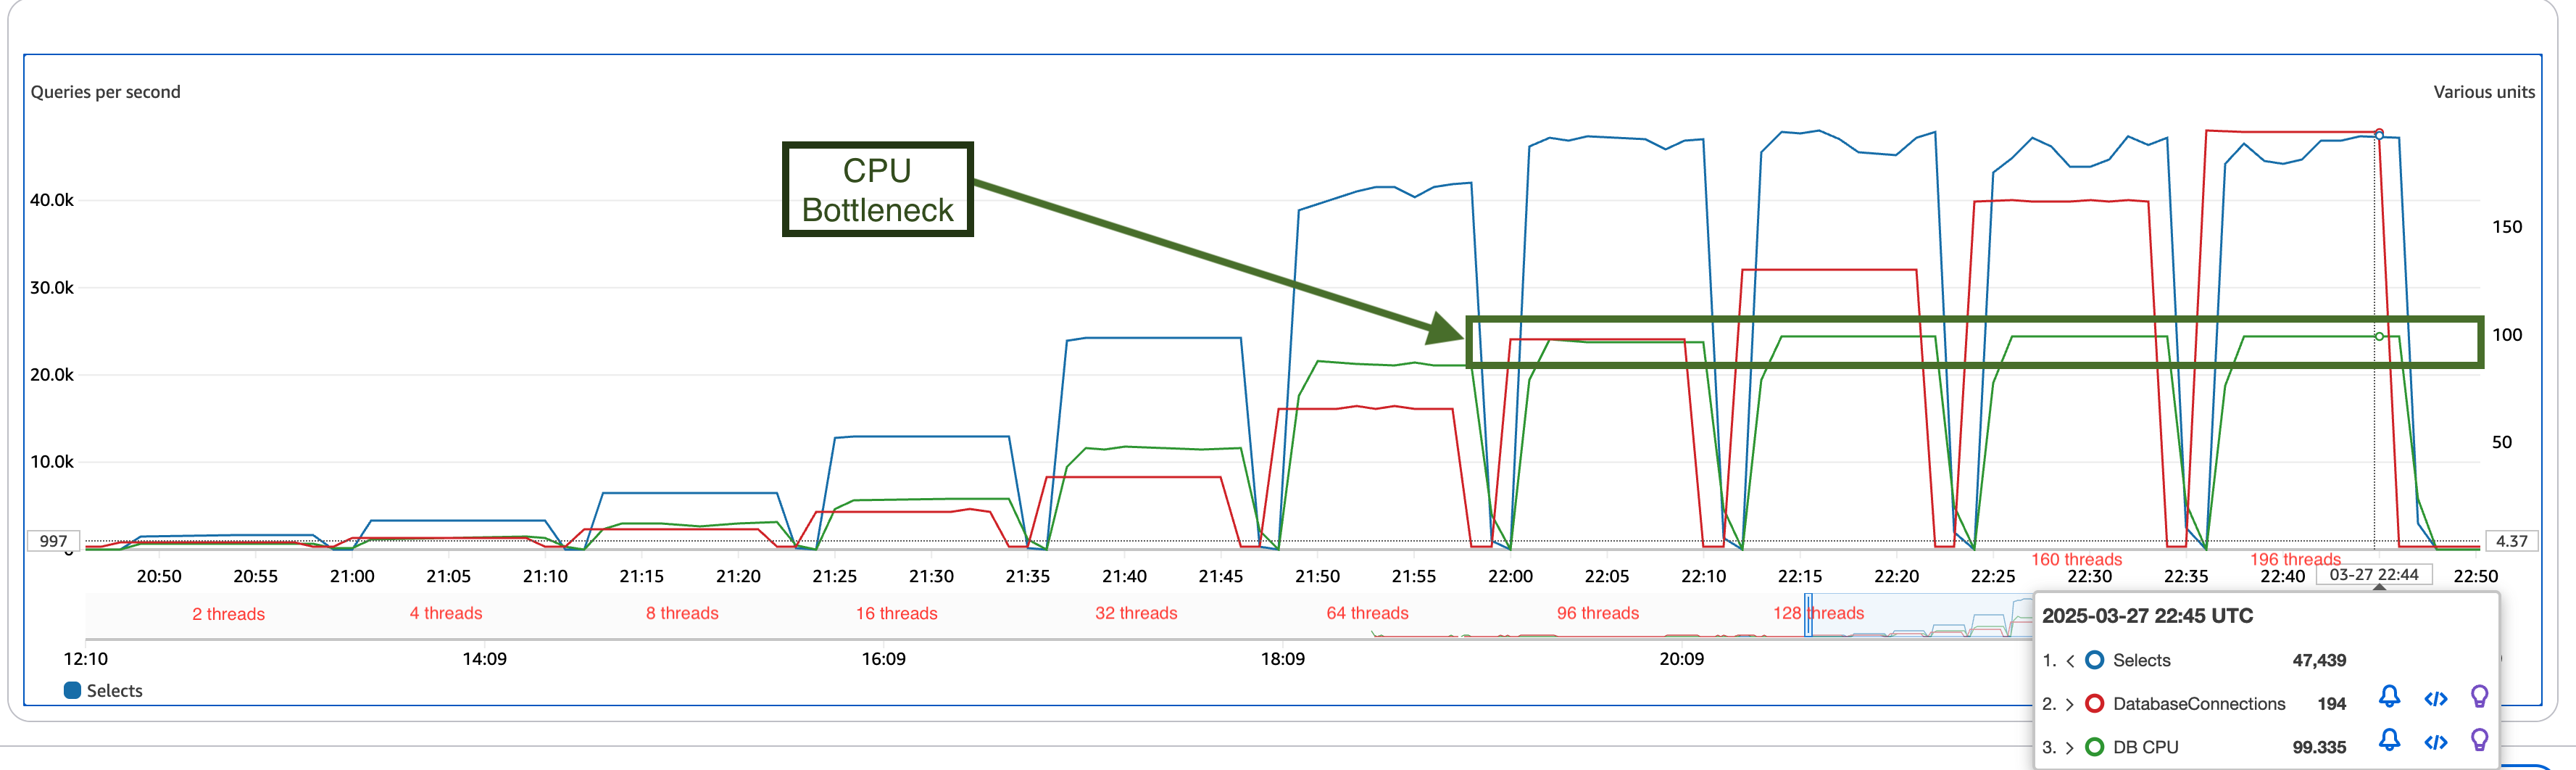
What is missing from the data generally analyzed for a database vi Cloudwatch is the user experience which you would find in an alternative monitoring or observability dashboard. This is the sum of many things including the latency to execute SQL queries. If we just evaluate the SQL (Something that EvalQL does), the equal throughput, but higher threads effect has a huge impact to the user experience. If you double the threads (96 to 192), the throughput is the same, but the average latency is 2x slower, the 95th percentile is 3x slower. The primary measure for my benchmarking strategy is latency, and the goal is to identify and better manage database concurrency.
It is a well known fact that user retention on a website in a competitive market segment is contingent on response time, and thus latency is critical. Just today I was on a website creating a personalized product to purchase, and the site’s slow performance had me do another search and use a competitor, where I made a purchase.
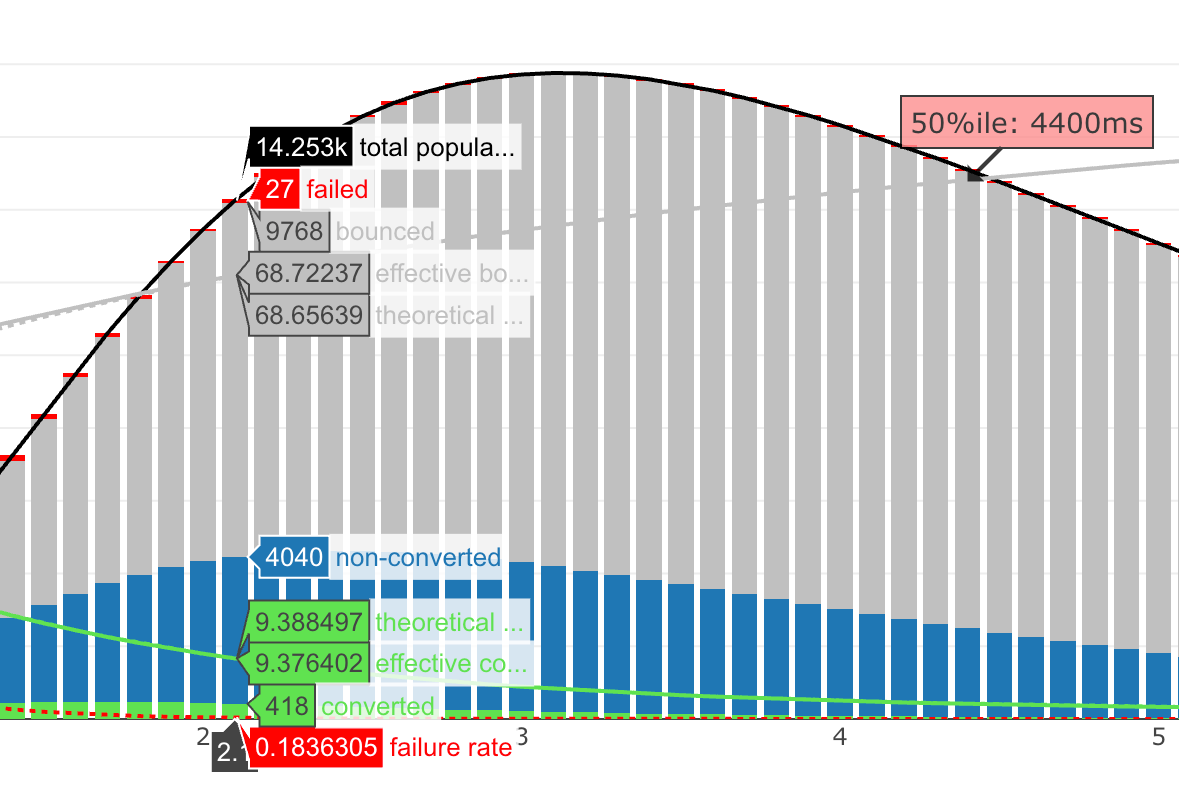
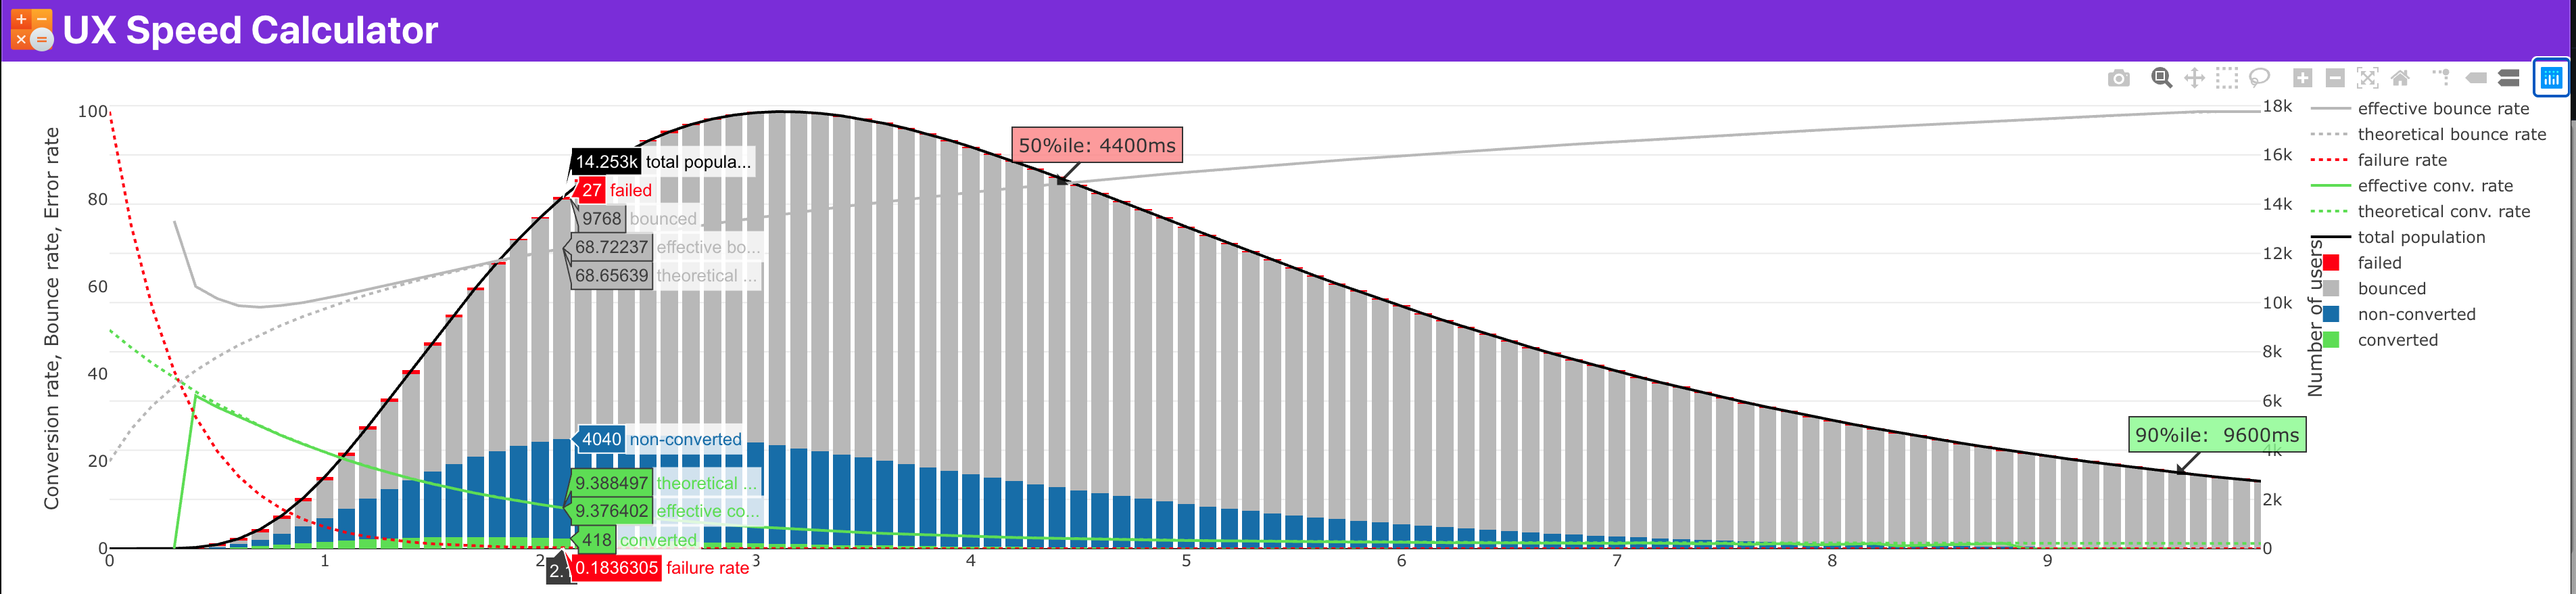
Performance is about many different and overlapping measurements with latency being a critical measure. Web performance expert Sergey Chernyshev provides a detailed insight into the impact of latency on conversions for your website with his UX Speed calculator
. This site has a detailed matrix of variables to tune, with 10 separate measurement outcomes to consider.
I think Sunny Bains at PingCap summed up succinctly when saying …experience up to a 40% increase in query latency without proper scaling solutions .