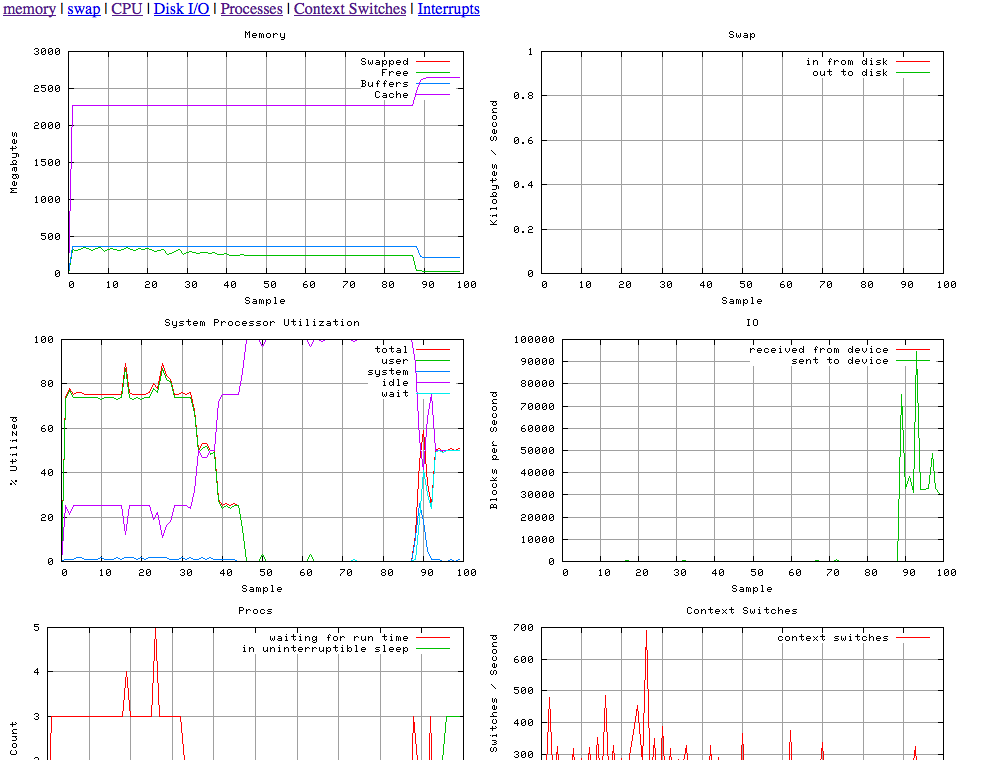
Taking the work already done with vmplot.sh, a useful tool for MySQL performance tuning by Yves and Matt at BigDBAHead, and in true Open Source fashion I’ve enhanced and modified for my own purposes.
These changes include:
- Error checking for ‘gnuplot’ command on the system
- Eliminate the first row of sample data, as this is often not a complete sample for the vmstat duration.
- Created a HTML output file for easy browser viewing
- Changed Memory scale values from Kilobytes to Megabytes
- Resizing png’s for optimal 1024×768 display output (2 per row)
And I get:

So more specifics of what I did.
Install gnuplot.
$ yum install gnuplot
Create vmstat sample file.
vmstat 1 100 > vmstat.out
Generate output graphs (need to work out those warnings)
 ./vmplot -i vmstat.out -o tmp
Warning: empty y range [0:0], adjusting to [-1:1]
Warning: empty y range [0:0], adjusting to [0:1]
And then I can view via a browser, in this case http://localhost/tmp/vmplot.htm
Some worthwhile references include Gnuplot Reference Manual, Gnuplot Examples and Gnuplot in Action
 Percona is a major player in providing services to the MySQL eco-system, the failure to include Percona speakers such as

